> ## Documentation Index
> Fetch the complete documentation index at: https://docs.userplane.io/llms.txt
> Use this file to discover all available pages before exploring further.
# Recording Viewer
> Interactive recording viewer with video playback, session metadata, and tabbed access to console, network, and action data
The recording viewer is the primary interactive app. It combines video playback, session metadata, and all captured session data in a single tabbed interface.
**Triggered by:** `userplane_show_recording`
## What it displays
The viewer opens with a video thumbnail and session metadata, with tabs for drilling into specific data:
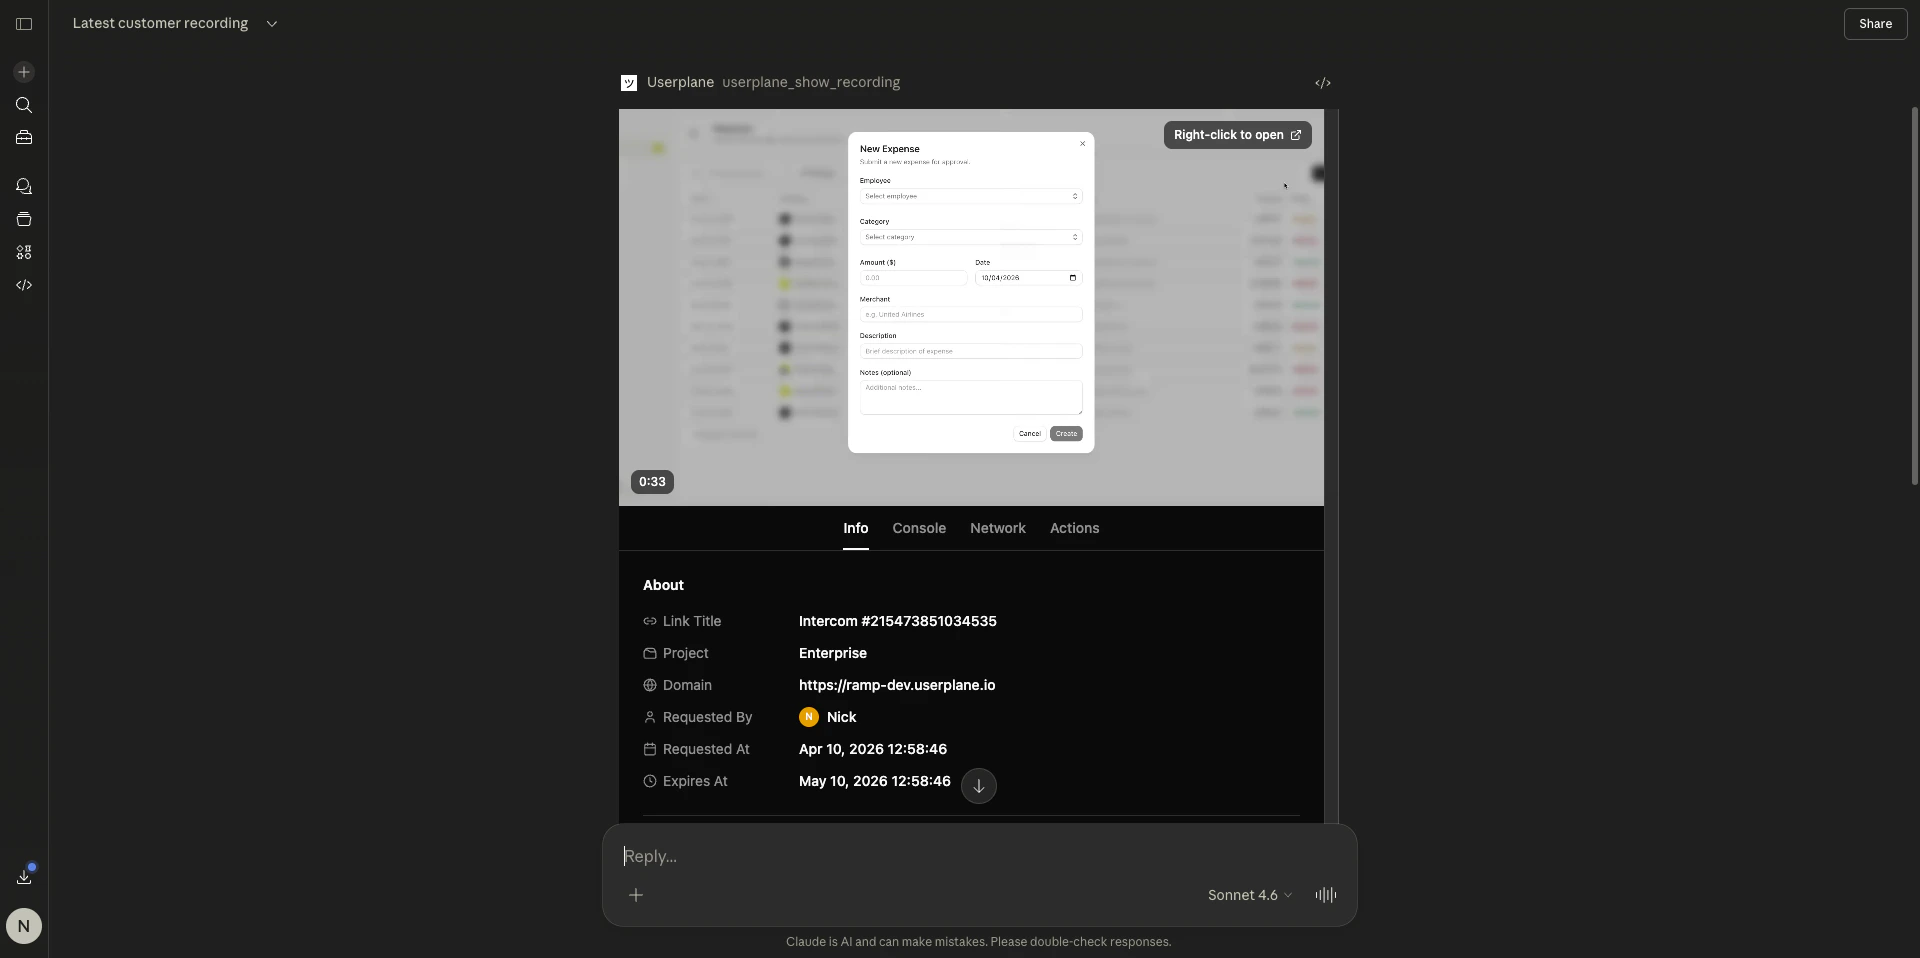
 **Info tab**
* Recording duration and creation date
* Creator name
* Project and domain
* Link title and reference (if the recording was captured through a link)
* Customer notes
* Integration details (provider type, reference, data)
* System information (OS, browser, capture date/time, timezone, language, screen size, window size)
* Custom metadata
**Console tab**
* Browser console log entries ordered by timestamp
* Color-coded log levels (error, warning, info, log, debug)
* Expandable entries for stack traces and detailed output
* Full-text search across all log messages
**Network tab**
* HTTP requests and responses ordered by timestamp
* Status codes, durations, and MIME types
* Expandable entries showing request/response headers and bodies
* JSON payloads formatted for readability
* Search and type filtering
**Actions tab**
* User interactions in chronological order
* Click events with element selectors
* Page navigation and URL changes
* Tab switches and page lifecycle events
* Expandable event details
## Example prompts
```text theme={null}
Show me the recording for {recordingId} in workspace {workspaceId}.
```
```text theme={null}
Here's a recording from a customer — https://dash.userplane.io/{workspaceId}/recordings/{recordingId}. Show me the full recording viewer.
```
```text theme={null}
Give me a full root cause analysis of this recording. Check the console for errors, the network requests for failures, and the user actions for anything unusual. Summarize what happened and what likely caused the issue. https://dash.userplane.io/{workspaceId}/recordings/{recordingId}
```
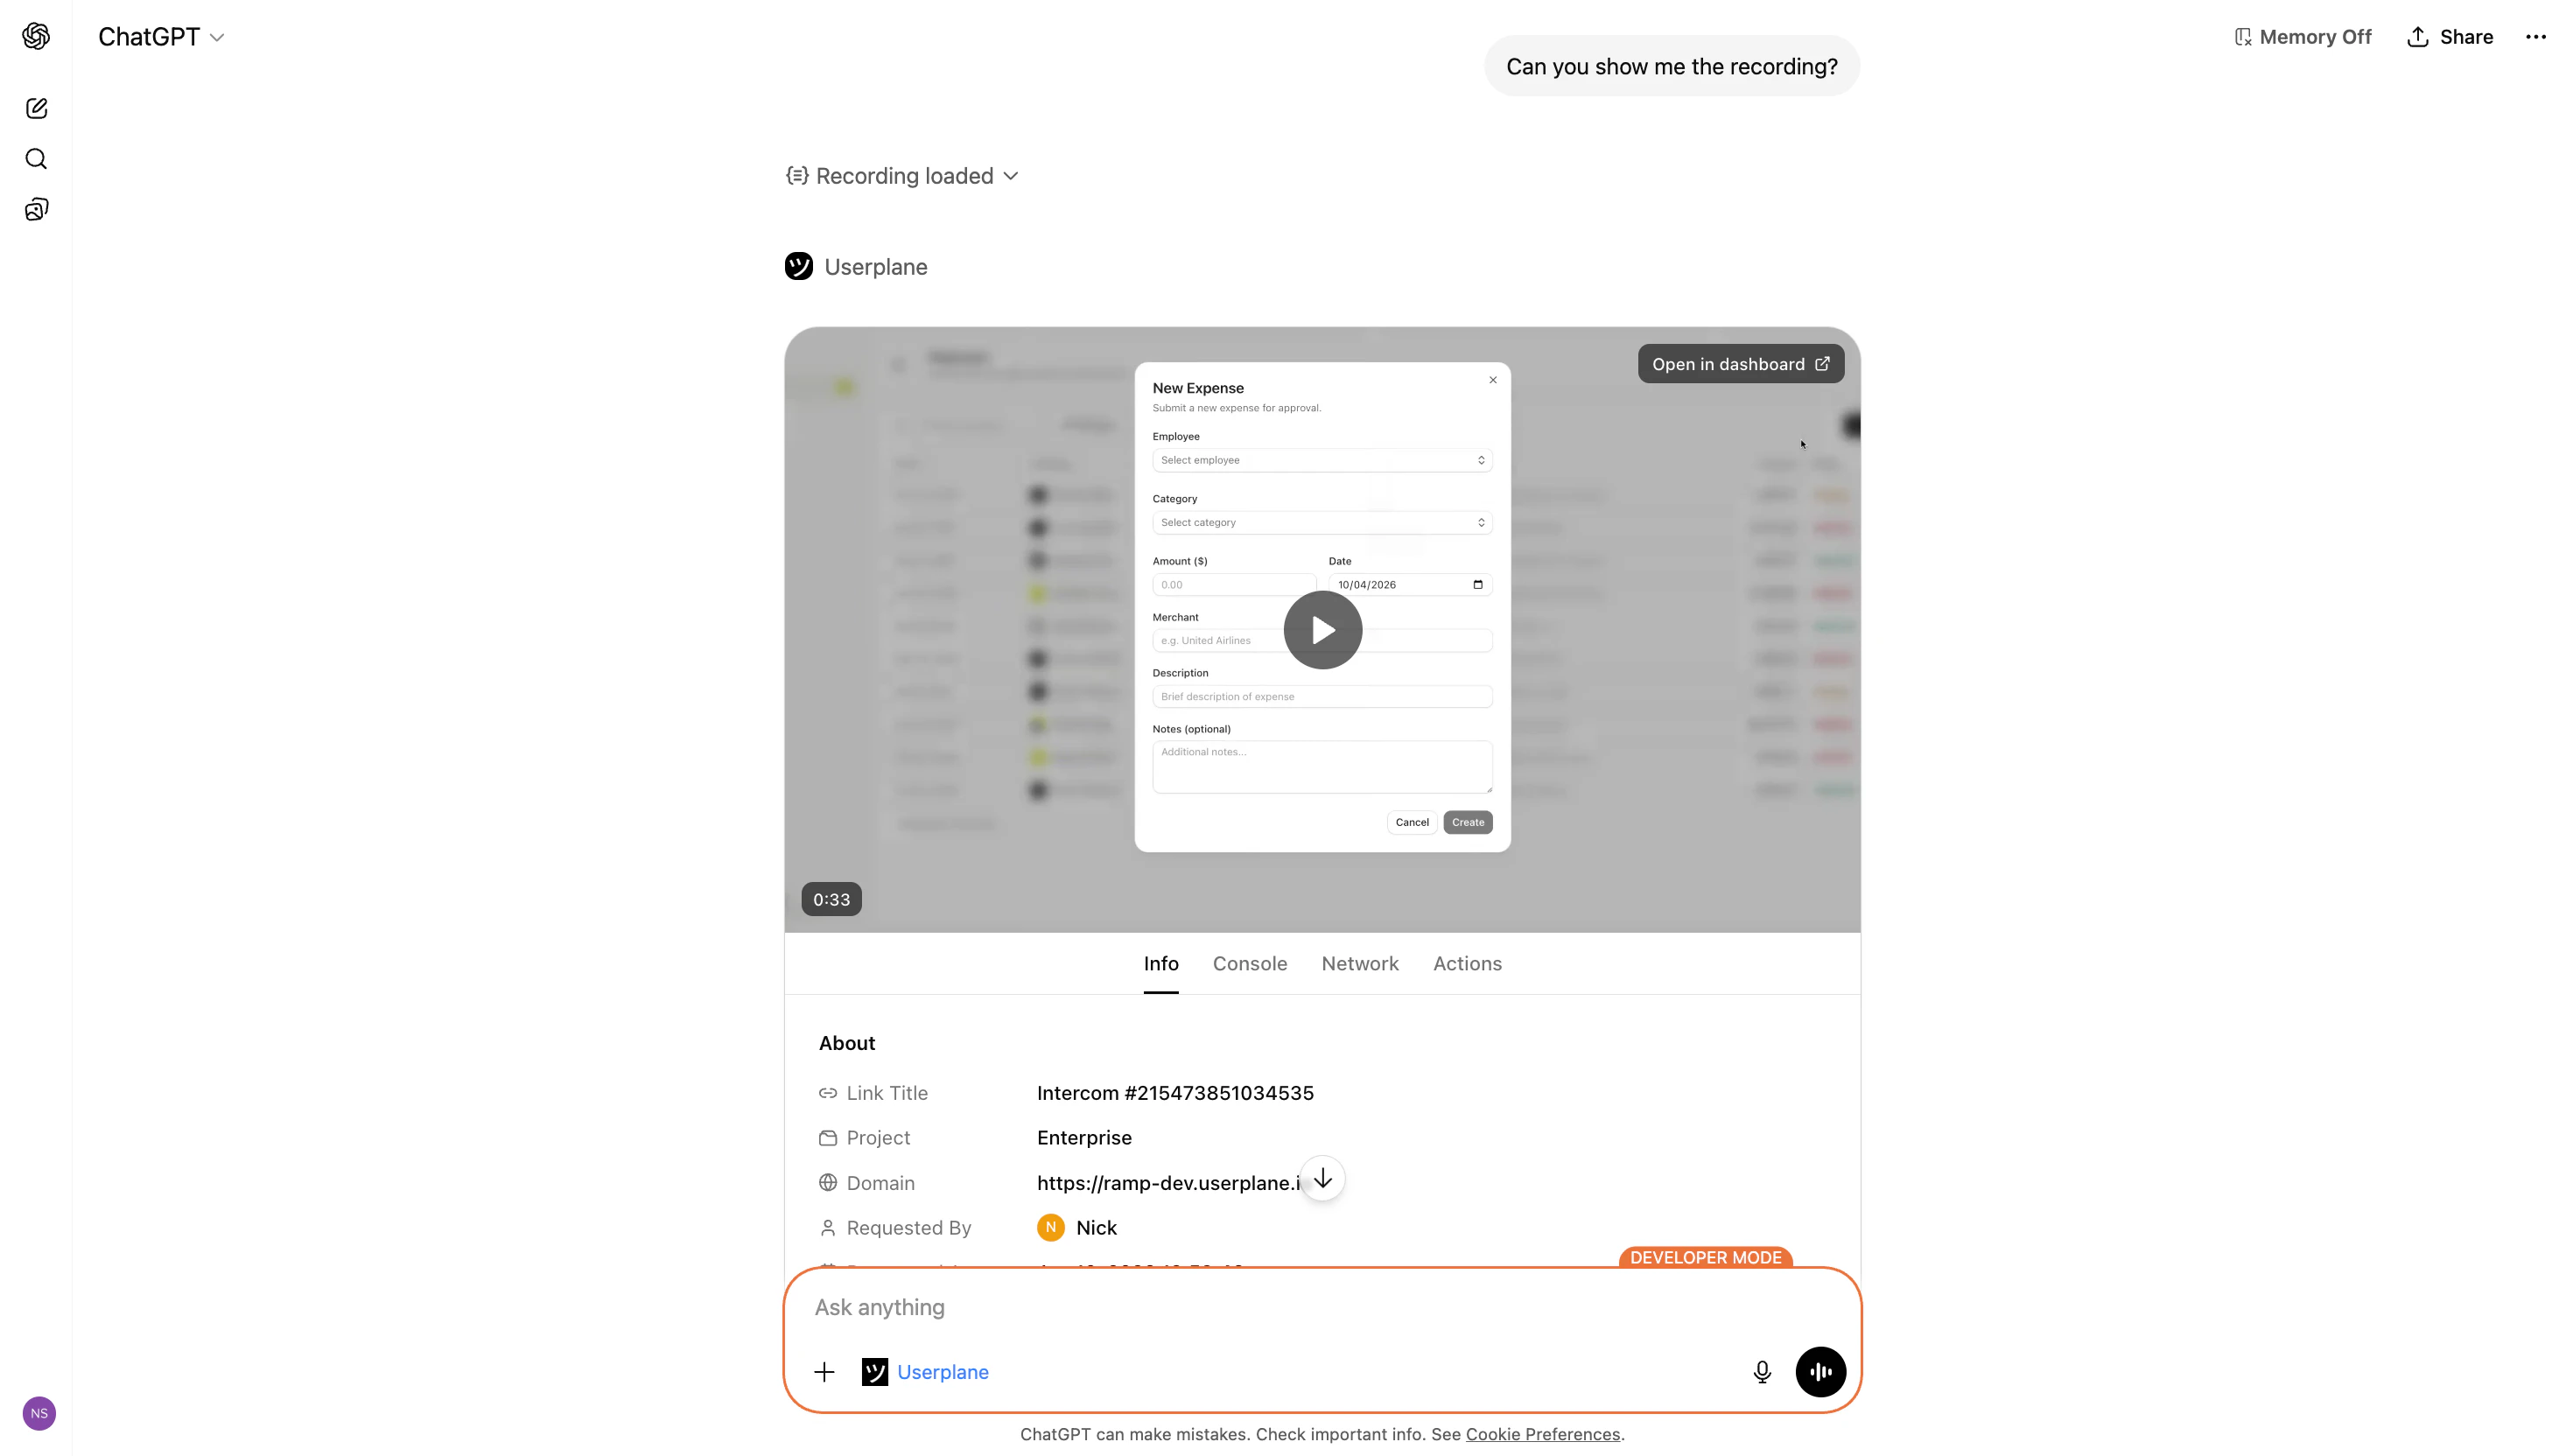
## Dashboard link
The recording viewer includes a direct link to the same recording in the Userplane dashboard. Use this to access the full playback experience with synchronized video and timeline scrubbing.
## Related articles
* [Resource Viewers](/integrations/mcp-apps-resources) — focused viewers for console logs, network requests, and user actions.
* [Interactive Apps Overview](/integrations/mcp-apps) — client support matrix and how MCP Apps work.
* [Recording Tools](/integrations/mcp-tools-recordings) — all recording-related MCP tools and parameters.
**Info tab**
* Recording duration and creation date
* Creator name
* Project and domain
* Link title and reference (if the recording was captured through a link)
* Customer notes
* Integration details (provider type, reference, data)
* System information (OS, browser, capture date/time, timezone, language, screen size, window size)
* Custom metadata
**Console tab**
* Browser console log entries ordered by timestamp
* Color-coded log levels (error, warning, info, log, debug)
* Expandable entries for stack traces and detailed output
* Full-text search across all log messages
**Network tab**
* HTTP requests and responses ordered by timestamp
* Status codes, durations, and MIME types
* Expandable entries showing request/response headers and bodies
* JSON payloads formatted for readability
* Search and type filtering
**Actions tab**
* User interactions in chronological order
* Click events with element selectors
* Page navigation and URL changes
* Tab switches and page lifecycle events
* Expandable event details
## Example prompts
```text theme={null}
Show me the recording for {recordingId} in workspace {workspaceId}.
```
```text theme={null}
Here's a recording from a customer — https://dash.userplane.io/{workspaceId}/recordings/{recordingId}. Show me the full recording viewer.
```
```text theme={null}
Give me a full root cause analysis of this recording. Check the console for errors, the network requests for failures, and the user actions for anything unusual. Summarize what happened and what likely caused the issue. https://dash.userplane.io/{workspaceId}/recordings/{recordingId}
```
## Dashboard link
The recording viewer includes a direct link to the same recording in the Userplane dashboard. Use this to access the full playback experience with synchronized video and timeline scrubbing.
## Related articles
* [Resource Viewers](/integrations/mcp-apps-resources) — focused viewers for console logs, network requests, and user actions.
* [Interactive Apps Overview](/integrations/mcp-apps) — client support matrix and how MCP Apps work.
* [Recording Tools](/integrations/mcp-tools-recordings) — all recording-related MCP tools and parameters.