> ## Documentation Index
> Fetch the complete documentation index at: https://docs.userplane.io/llms.txt
> Use this file to discover all available pages before exploring further.
# Resource Viewers
> Focused interactive viewers for console logs, network requests, and user actions
Resource viewers provide focused, single-purpose views into specific recording data. Use them when you need to drill into one type of session data without the full recording interface.
## Console log viewer
**Triggered by:** `userplane_show_rec_console`
Displays browser console log entries captured during the recording.
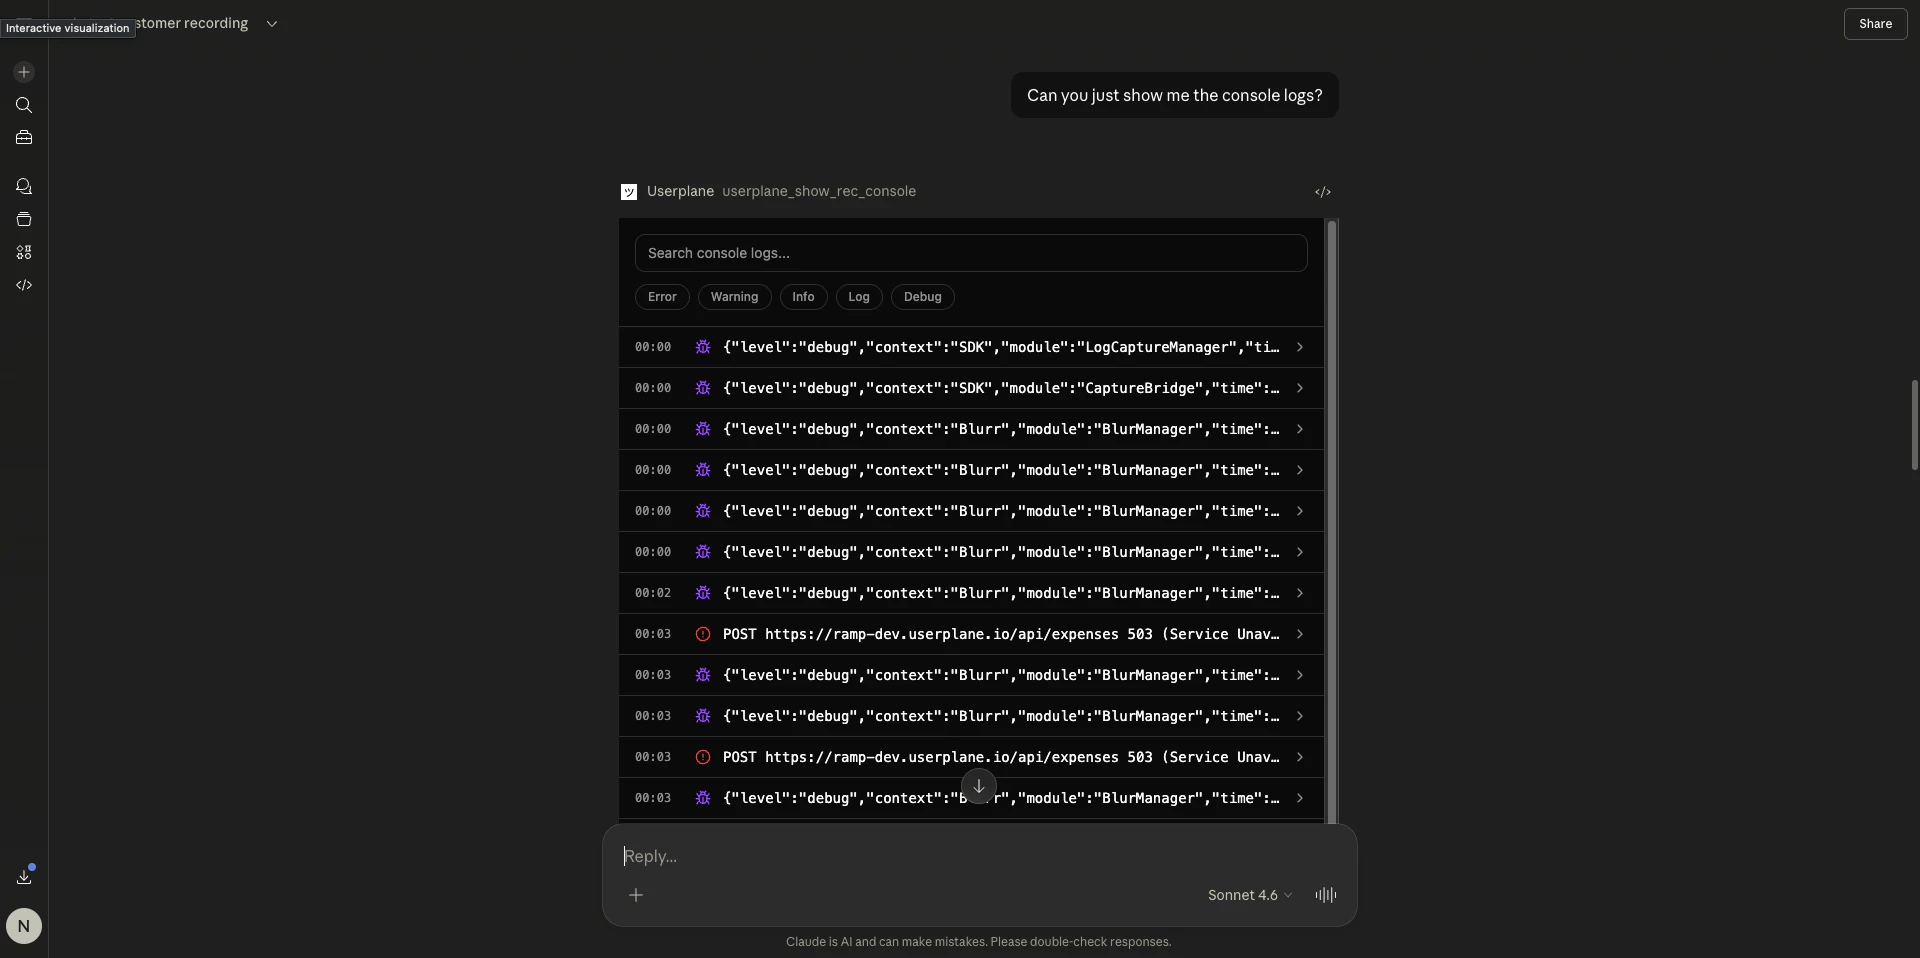
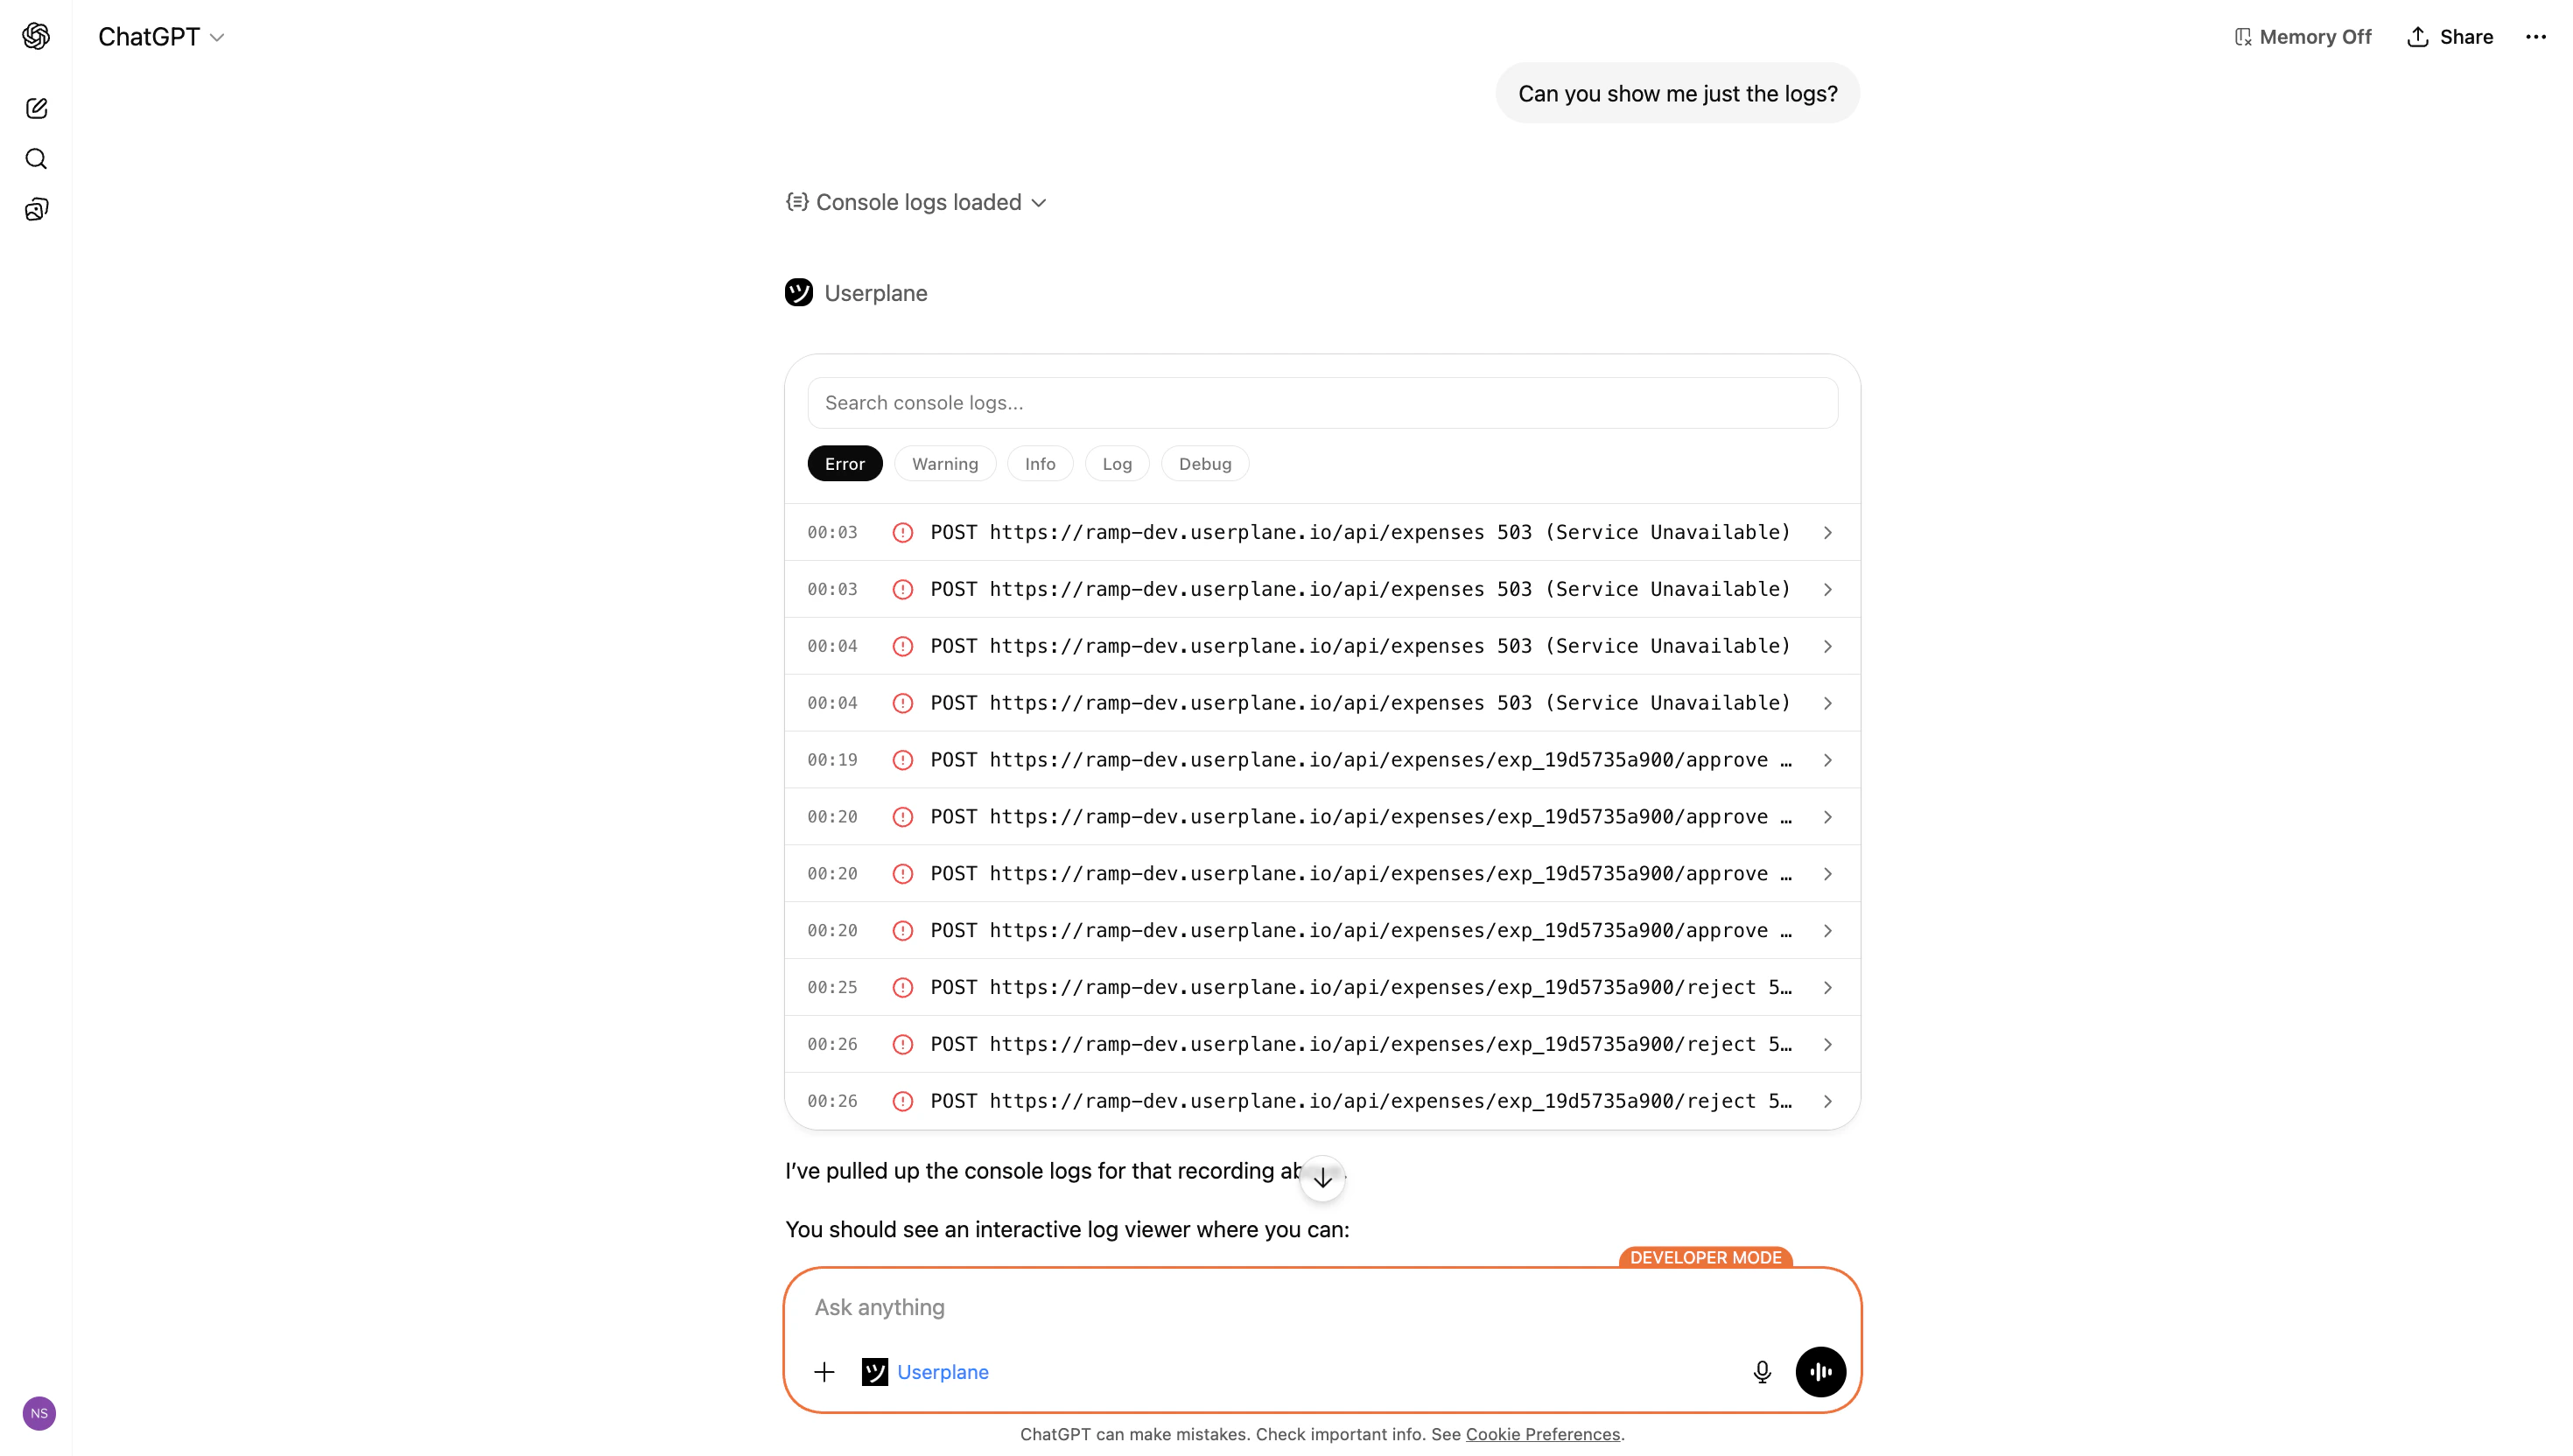 * **Level filtering** — toggle visibility by level: error, warning, info, log, debug
* **Search** — full-text search across all log messages
* **Timestamps** — time relative to recording start
* **Expandable entries** — click to reveal stack traces, source URLs, and detailed output
* **Color coding** — entries styled by severity (red for errors, yellow for warnings)
### Example prompts
```text theme={null}
Show me the console logs for recording {recordingId} in workspace {workspaceId}. Filter to errors only.
```
```text theme={null}
Show me the console logs for this recording. Are there any JavaScript errors or unhandled exceptions? https://dash.userplane.io/{workspaceId}/recordings/{recordingId}
```
***
## Network request viewer
**Triggered by:** `userplane_show_rec_network`
Displays HTTP request and response entries captured during the recording.
* **Level filtering** — toggle visibility by level: error, warning, info, log, debug
* **Search** — full-text search across all log messages
* **Timestamps** — time relative to recording start
* **Expandable entries** — click to reveal stack traces, source URLs, and detailed output
* **Color coding** — entries styled by severity (red for errors, yellow for warnings)
### Example prompts
```text theme={null}
Show me the console logs for recording {recordingId} in workspace {workspaceId}. Filter to errors only.
```
```text theme={null}
Show me the console logs for this recording. Are there any JavaScript errors or unhandled exceptions? https://dash.userplane.io/{workspaceId}/recordings/{recordingId}
```
***
## Network request viewer
**Triggered by:** `userplane_show_rec_network`
Displays HTTP request and response entries captured during the recording.
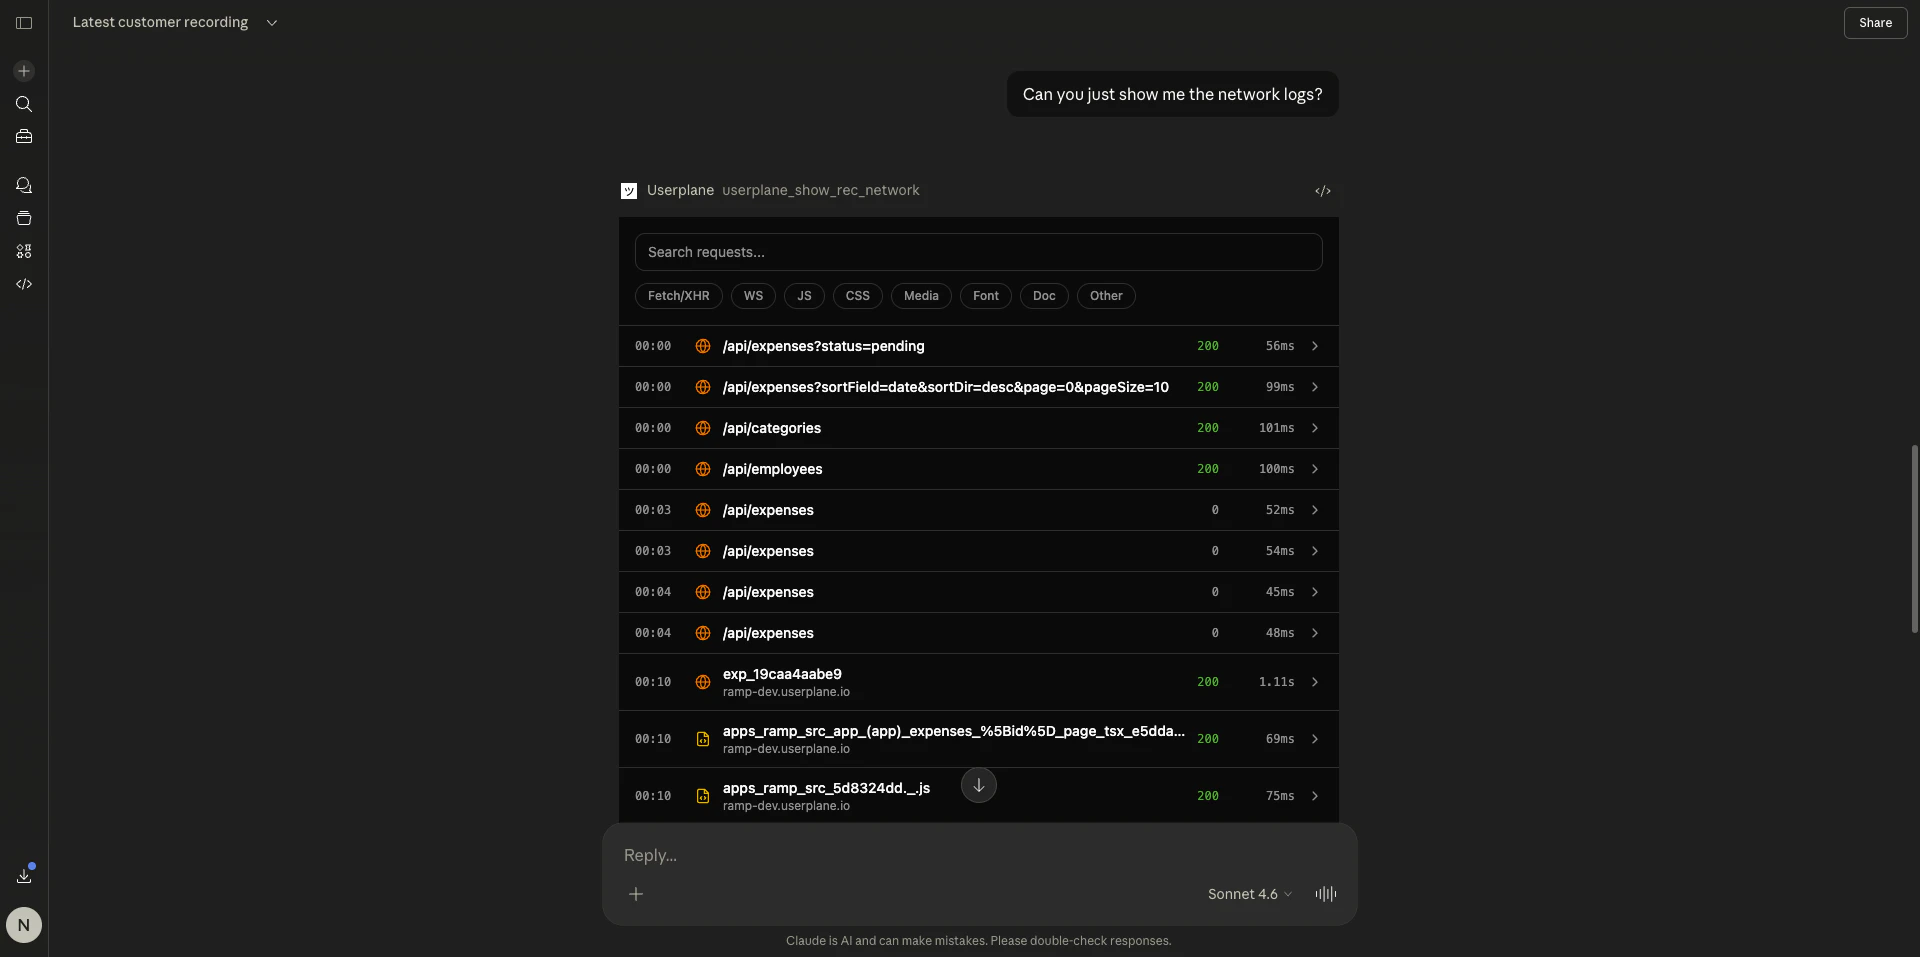
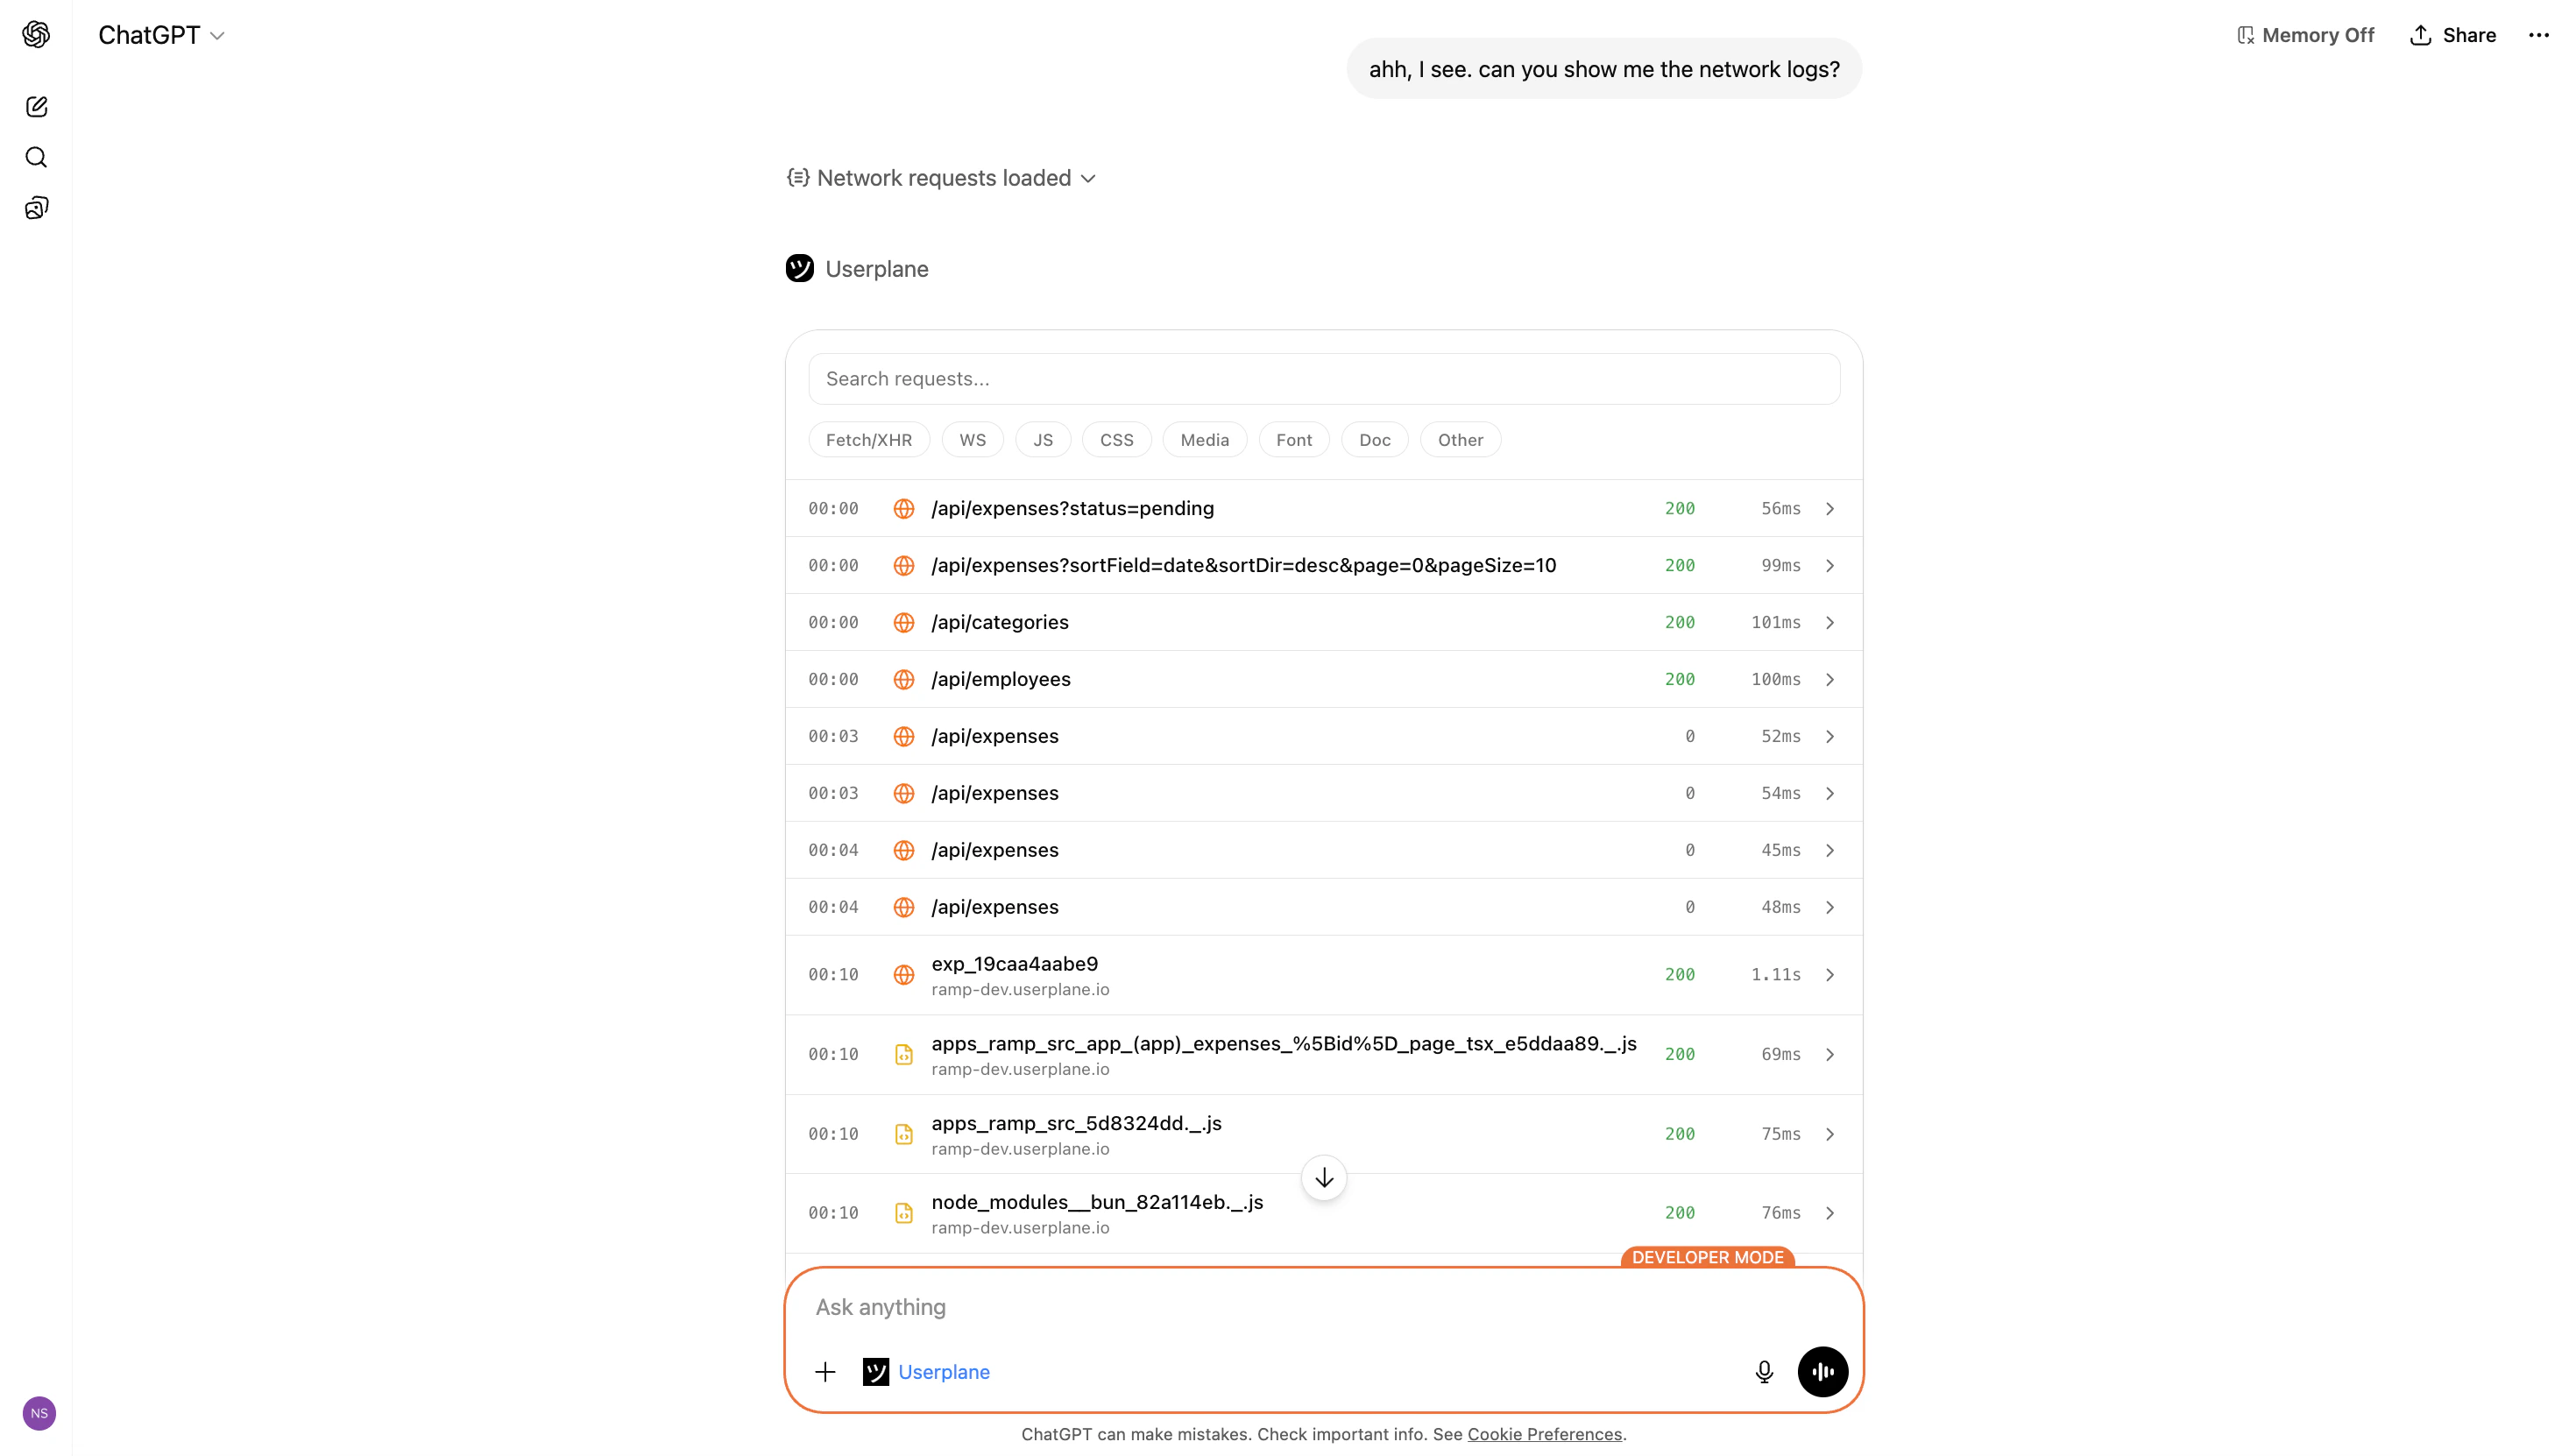 * **Status codes** — color-coded by response class (2xx, 3xx, 4xx, 5xx)
* **Durations** — request timing in milliseconds
* **Type filtering** — filter by request type (XHR, fetch, document, stylesheet, script, image)
* **Search** — search by URL, method, or status code
* **Expandable entries** — click to reveal:
* Request and response headers
* Request and response bodies
* JSON payloads formatted for readability
* MIME type and content length
### Example prompts
```text theme={null}
Show me the network requests for recording {recordingId} in workspace {workspaceId}. I need to find the failing API calls.
```
```text theme={null}
Check the network requests in this recording. Are there any 500 errors, 404s, or requests that took longer than 3 seconds? https://dash.userplane.io/{workspaceId}/recordings/{recordingId}
```
***
## User action viewer
**Triggered by:** `userplane_show_rec_actions`
Displays user interaction events captured during the recording.
* **Status codes** — color-coded by response class (2xx, 3xx, 4xx, 5xx)
* **Durations** — request timing in milliseconds
* **Type filtering** — filter by request type (XHR, fetch, document, stylesheet, script, image)
* **Search** — search by URL, method, or status code
* **Expandable entries** — click to reveal:
* Request and response headers
* Request and response bodies
* JSON payloads formatted for readability
* MIME type and content length
### Example prompts
```text theme={null}
Show me the network requests for recording {recordingId} in workspace {workspaceId}. I need to find the failing API calls.
```
```text theme={null}
Check the network requests in this recording. Are there any 500 errors, 404s, or requests that took longer than 3 seconds? https://dash.userplane.io/{workspaceId}/recordings/{recordingId}
```
***
## User action viewer
**Triggered by:** `userplane_show_rec_actions`
Displays user interaction events captured during the recording.
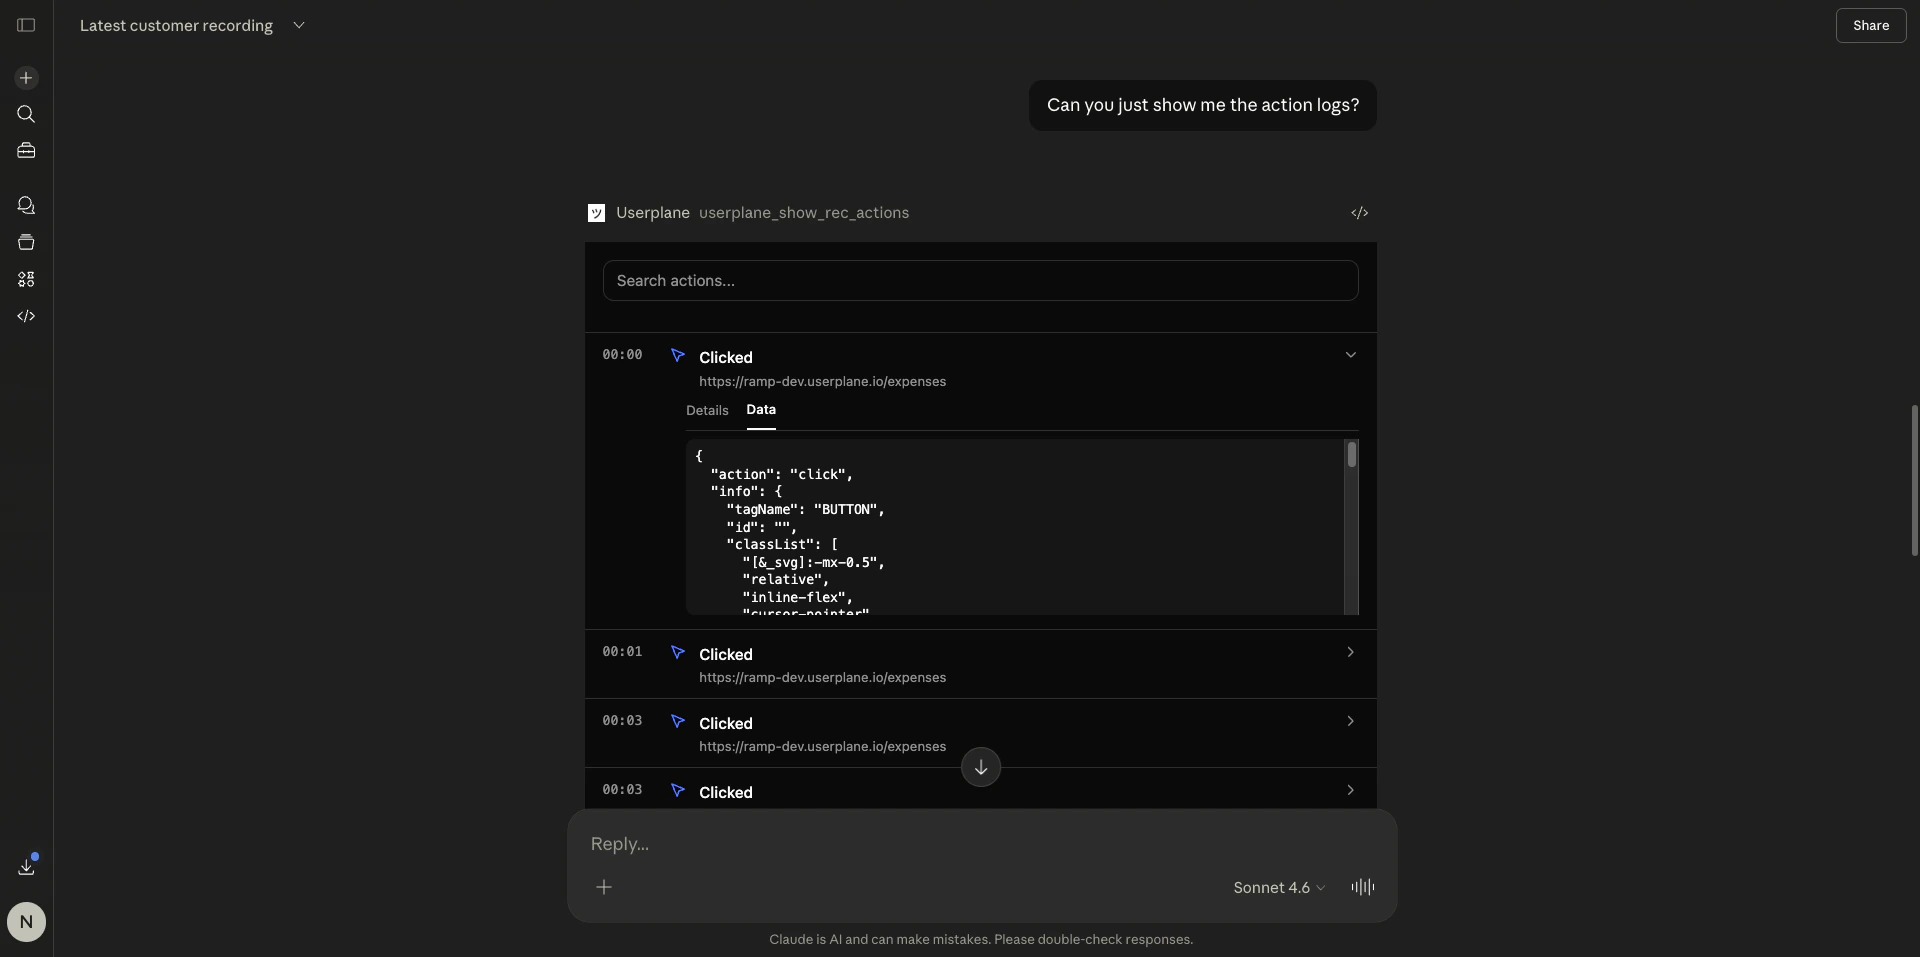
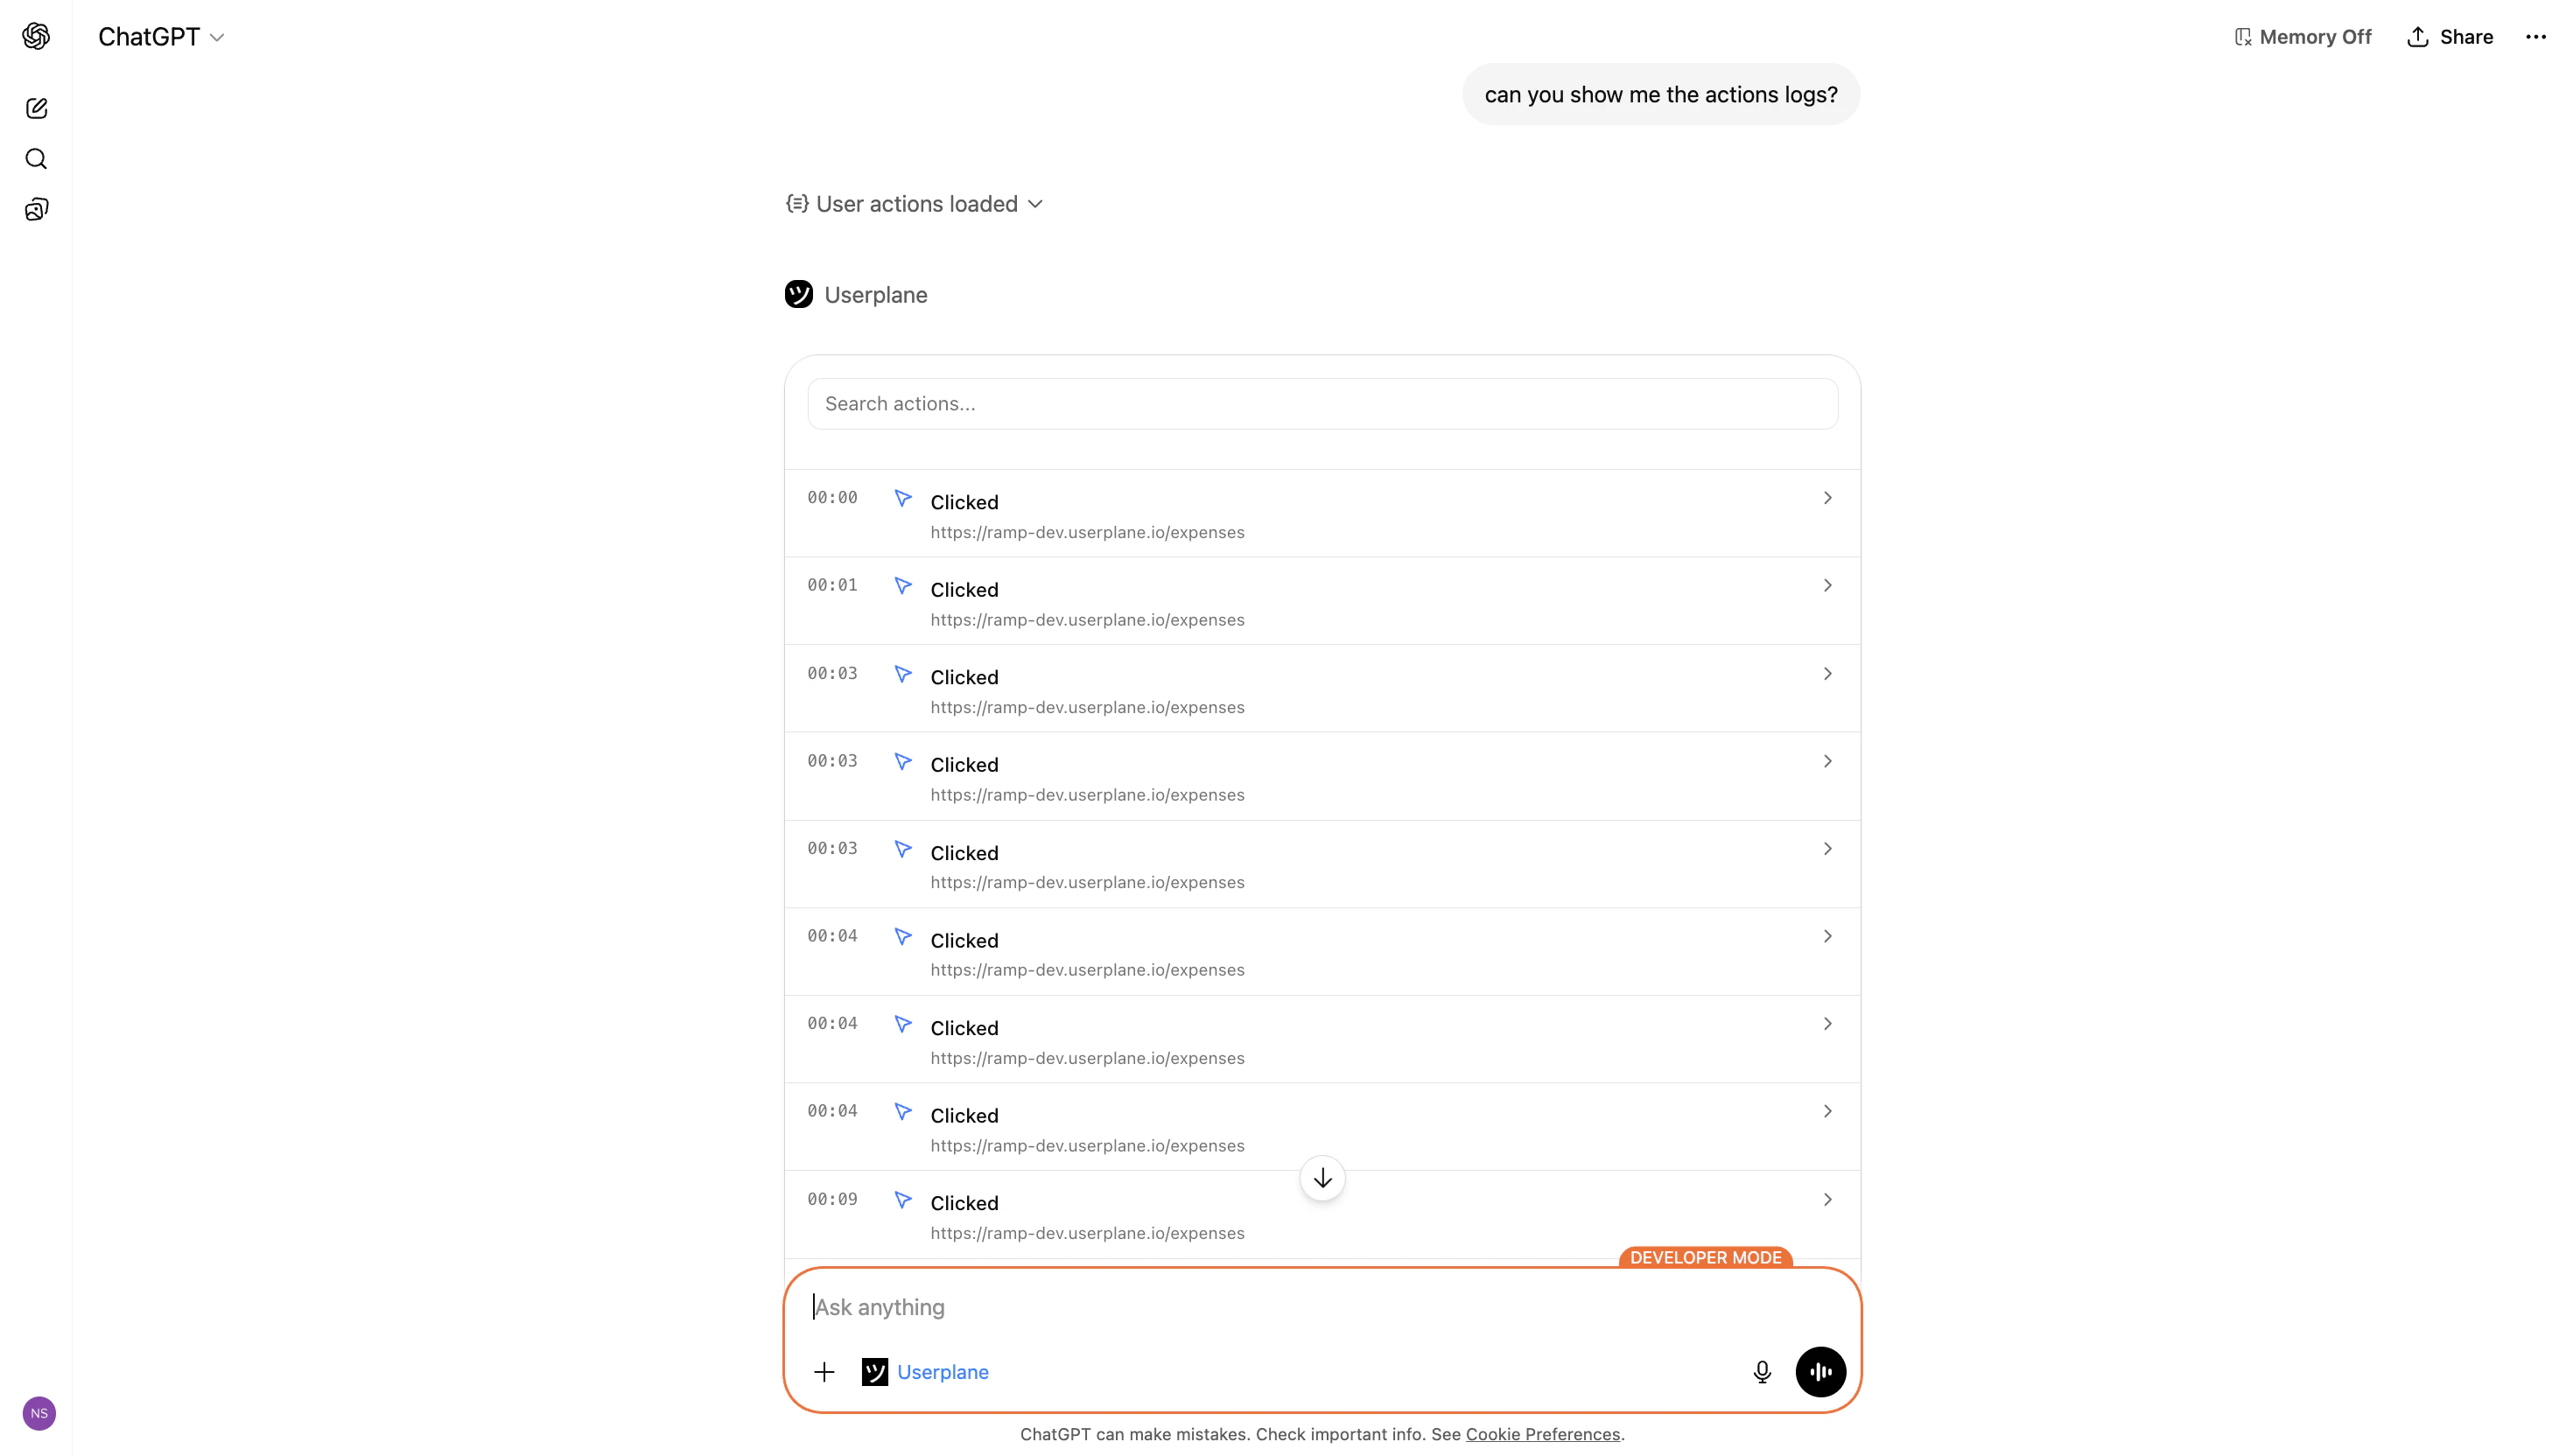 * **Action types** — clicks, page navigation, tab switches, page lifecycle events (load, unload, visibility change)
* **Type filtering** — filter by action category
* **Search** — search across action details
* **Timestamps** — time relative to recording start
* **Expandable entries** — click to reveal:
* Element selectors (for click events)
* Source and destination URLs (for navigation)
* Event-specific data
### Example prompts
```text theme={null}
Show me the user actions for recording {recordingId} in workspace {workspaceId}. What did the user do before the error occurred?
```
```text theme={null}
Walk me through what the user did in this recording. What pages did they visit, what did they click, and where did things break? https://dash.userplane.io/{workspaceId}/recordings/{recordingId}
```
***
## When to use resource viewers vs. the recording viewer
| Use case | Tool |
| ----------------------------------------------- | --------------------------------------------------------------------------------- |
| Full recording overview with video and all data | `userplane_show_recording` ([Recording viewer](/integrations/mcp-apps-recording)) |
| Focused console error investigation | `userplane_show_rec_console` |
| Focused network request debugging | `userplane_show_rec_network` |
| Focused user journey analysis | `userplane_show_rec_actions` |
Start with the full recording viewer for initial triage. Switch to resource viewers when you need
to focus on a specific data type with dedicated filtering and search.
## Related articles
* [Recording Viewer](/integrations/mcp-apps-recording) — full recording viewer with video, metadata, and all session data.
* [Interactive Apps Overview](/integrations/mcp-apps) — client support matrix and how MCP Apps work.
* [Recording Tools](/integrations/mcp-tools-recordings) — all recording-related MCP tools and parameters.
* **Action types** — clicks, page navigation, tab switches, page lifecycle events (load, unload, visibility change)
* **Type filtering** — filter by action category
* **Search** — search across action details
* **Timestamps** — time relative to recording start
* **Expandable entries** — click to reveal:
* Element selectors (for click events)
* Source and destination URLs (for navigation)
* Event-specific data
### Example prompts
```text theme={null}
Show me the user actions for recording {recordingId} in workspace {workspaceId}. What did the user do before the error occurred?
```
```text theme={null}
Walk me through what the user did in this recording. What pages did they visit, what did they click, and where did things break? https://dash.userplane.io/{workspaceId}/recordings/{recordingId}
```
***
## When to use resource viewers vs. the recording viewer
| Use case | Tool |
| ----------------------------------------------- | --------------------------------------------------------------------------------- |
| Full recording overview with video and all data | `userplane_show_recording` ([Recording viewer](/integrations/mcp-apps-recording)) |
| Focused console error investigation | `userplane_show_rec_console` |
| Focused network request debugging | `userplane_show_rec_network` |
| Focused user journey analysis | `userplane_show_rec_actions` |
Start with the full recording viewer for initial triage. Switch to resource viewers when you need
to focus on a specific data type with dedicated filtering and search.
## Related articles
* [Recording Viewer](/integrations/mcp-apps-recording) — full recording viewer with video, metadata, and all session data.
* [Interactive Apps Overview](/integrations/mcp-apps) — client support matrix and how MCP Apps work.
* [Recording Tools](/integrations/mcp-tools-recordings) — all recording-related MCP tools and parameters.