> ## Documentation Index
> Fetch the complete documentation index at: https://docs.userplane.io/llms.txt
> Use this file to discover all available pages before exploring further.

# Reviewing Recordings

> Browse, filter, and sort recordings in the grid view

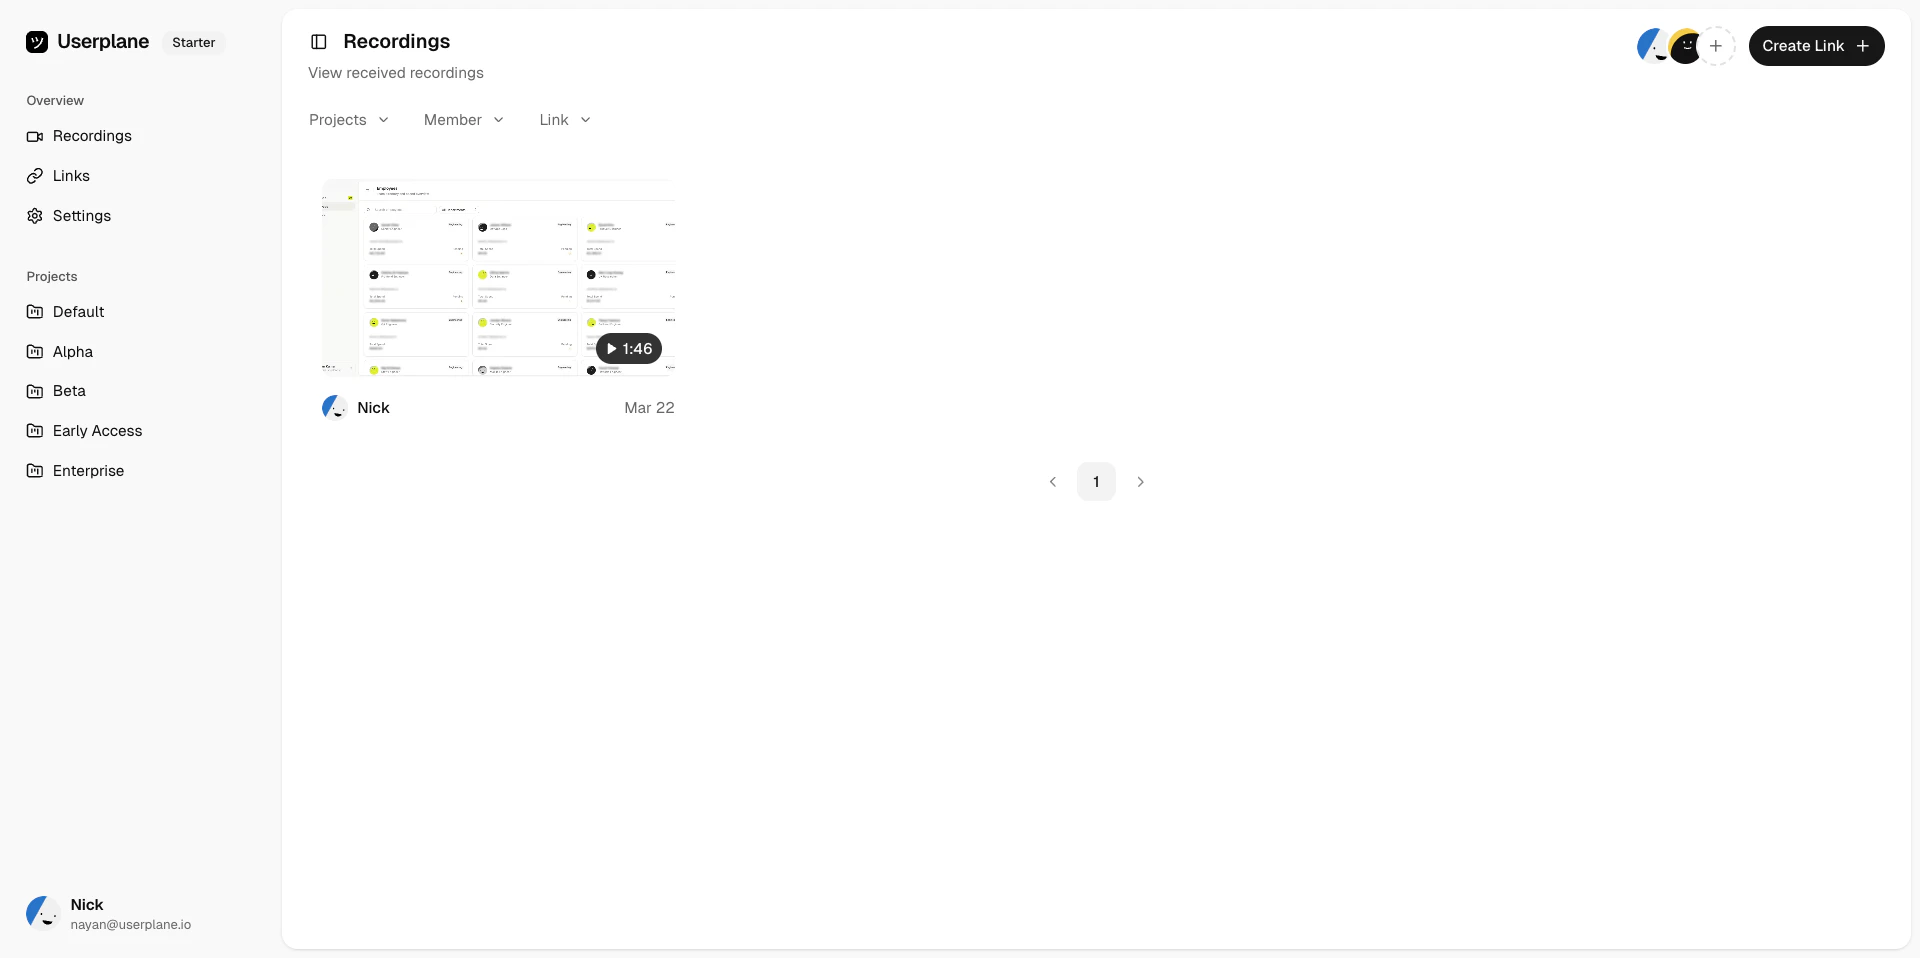
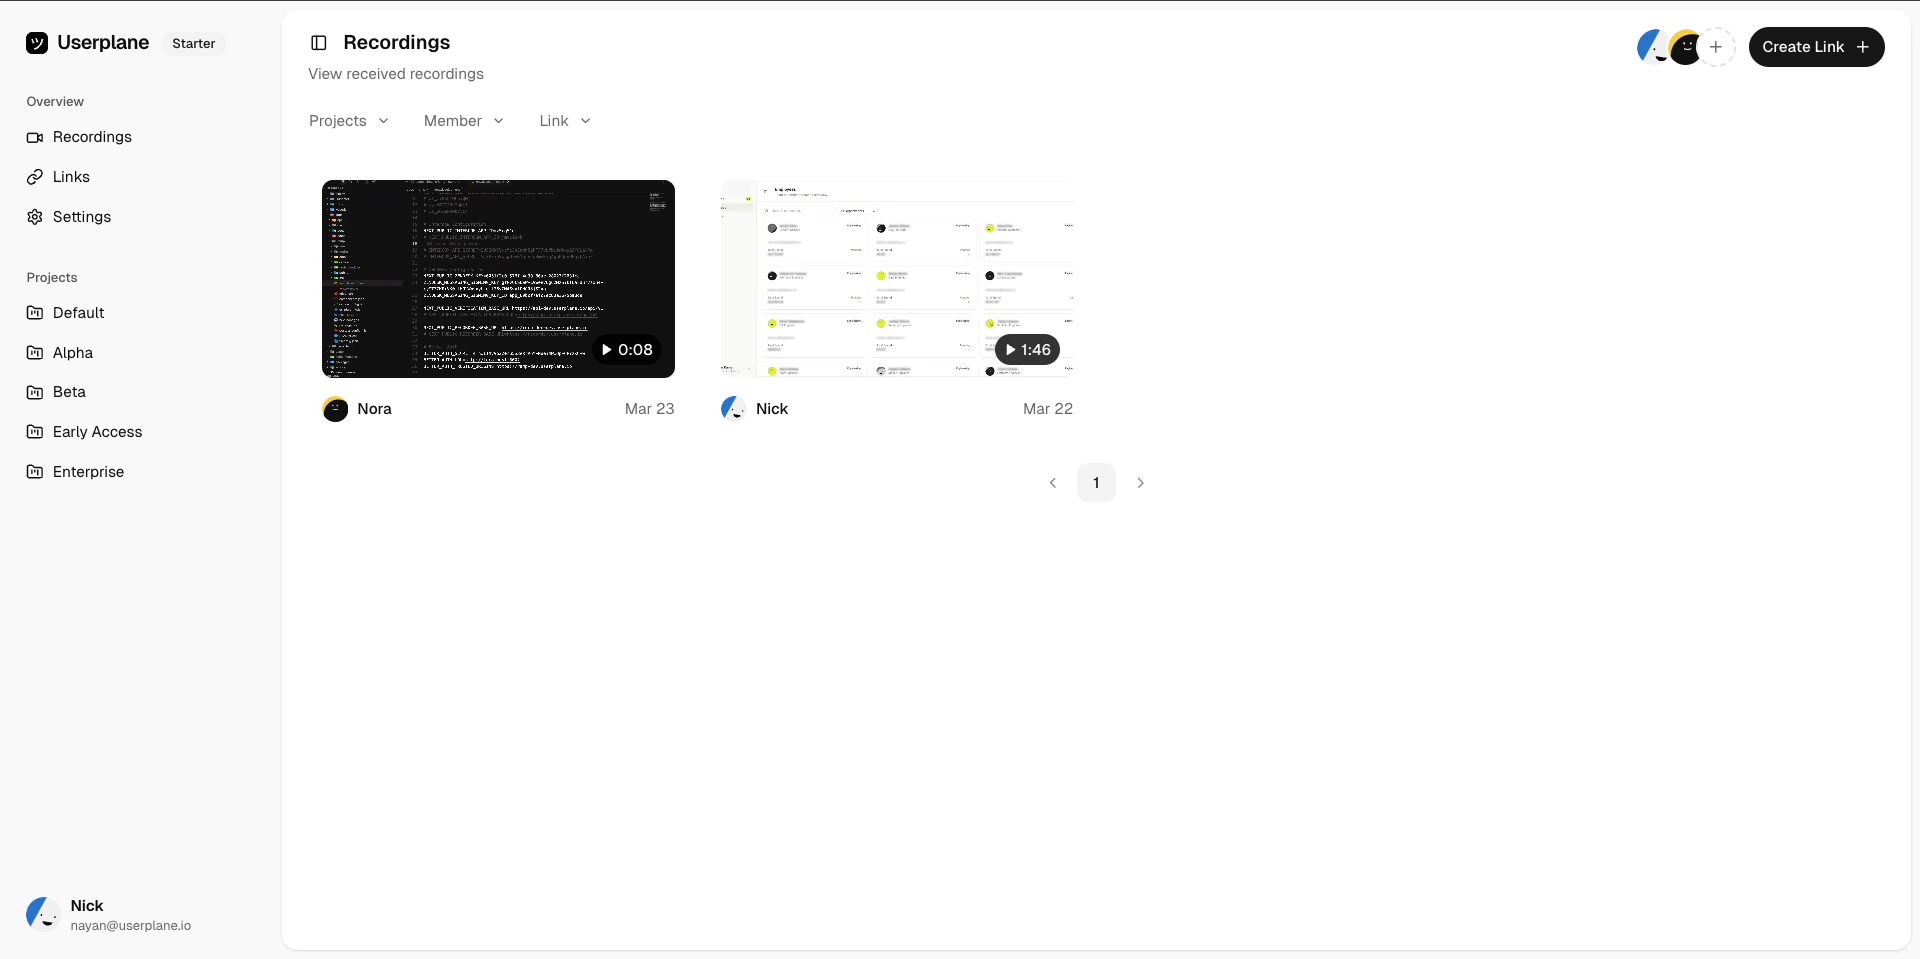
The [Recordings](https://dash.userplane.io/_/recordings) page gives you a grid view of all recordings in your workspace. From here you can browse, filter, sort, and open recordings for detailed review.

## Grid layout

Recordings are displayed in a grid with up to **16 recordings per page**. Each card shows a thumbnail preview along with key details like the project, reference, and timestamp.

<Frame caption="Recordings grid view">
  <img src="https://mintcdn.com/userplane/IKCB4f_KBaL0xsjW/media/recordings/list-recording/list-recording-view.png?fit=max&auto=format&n=IKCB4f_KBaL0xsjW&q=85&s=5be5d275cf8c550f65c56f101d82d5db" width="1920" height="958" data-path="media/recordings/list-recording/list-recording-view.png" />
</Frame>

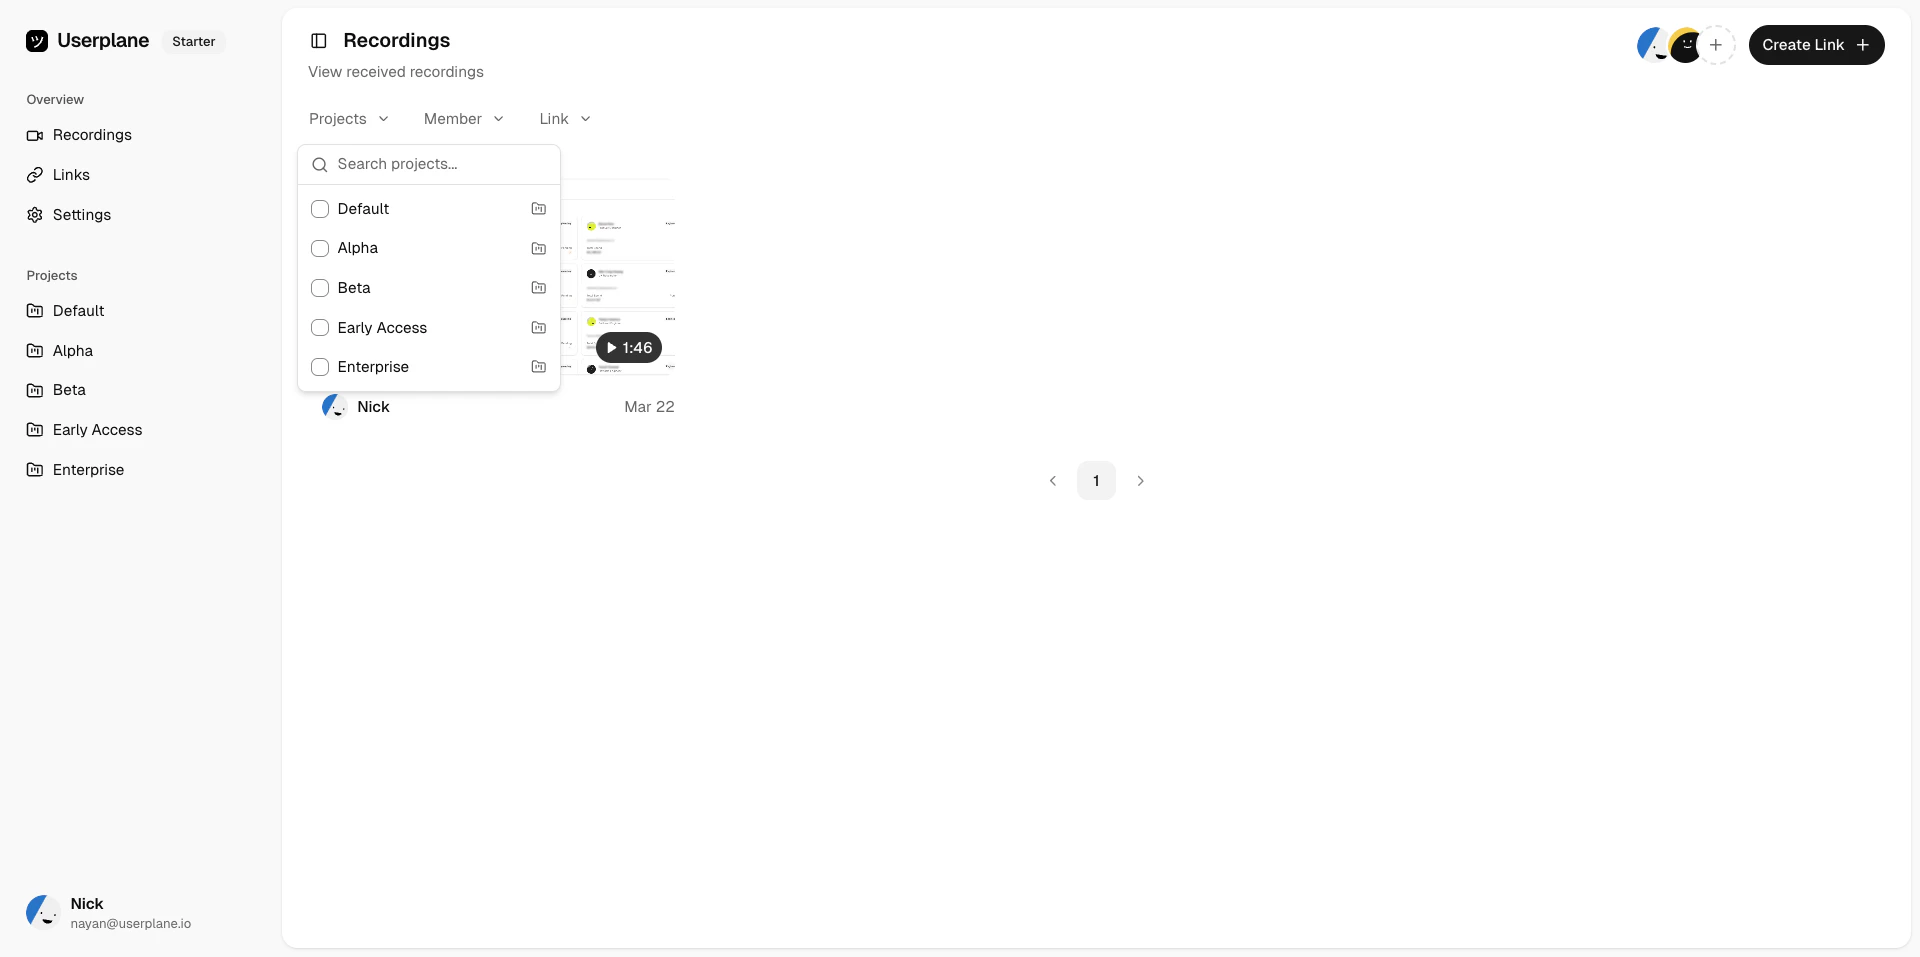
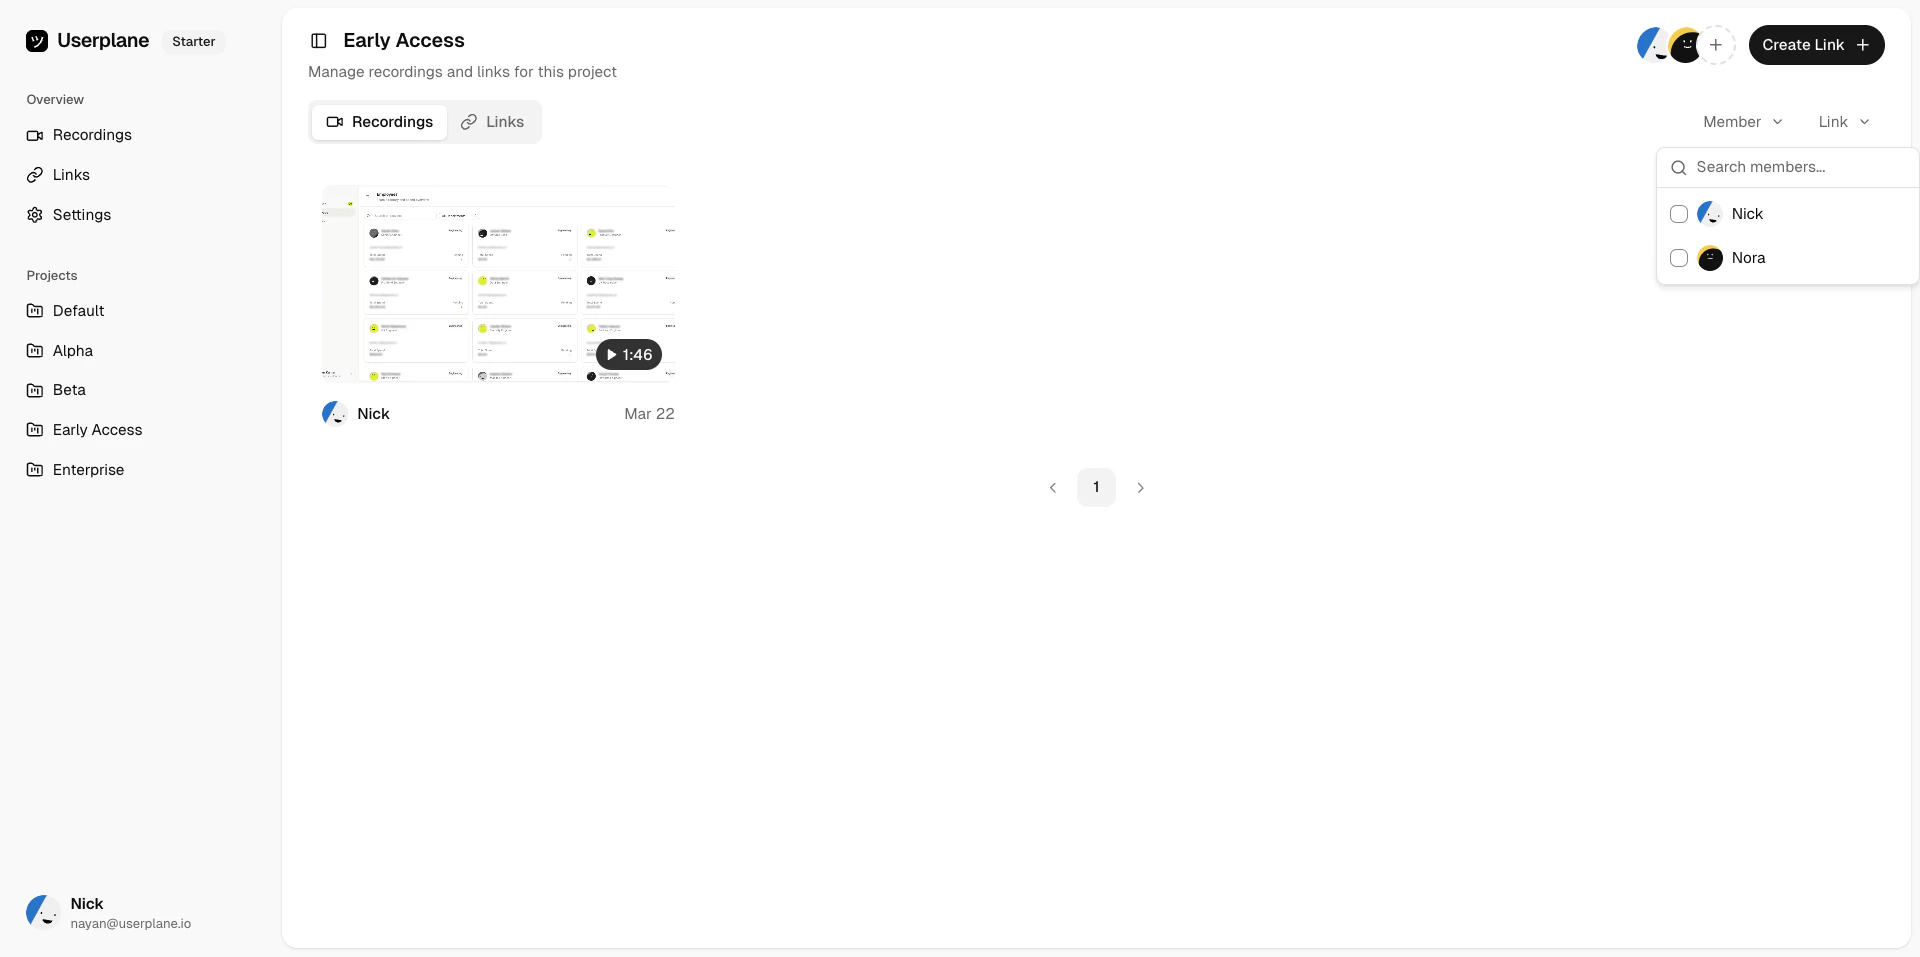
## Filtering recordings

Use the filter controls to narrow down the list:

<Tabs>
  <Tab title="By project">
    Show recordings from a specific project.

    <Frame caption="Filter by project">
      <img src="https://mintcdn.com/userplane/IKCB4f_KBaL0xsjW/media/recordings/list-recording/filter-recording-by-project.png?fit=max&auto=format&n=IKCB4f_KBaL0xsjW&q=85&s=52fd596525b2c8ed67ef44797a9d4d64" width="1920" height="957" data-path="media/recordings/list-recording/filter-recording-by-project.png" />
    </Frame>

    <Frame caption="Filter by project">
      <img src="https://mintcdn.com/userplane/IKCB4f_KBaL0xsjW/media/recordings/recordings-project-filter.png?fit=max&auto=format&n=IKCB4f_KBaL0xsjW&q=85&s=dfc4fcf6b451b45aa50fef5aba330381" width="1342" height="906" data-path="media/recordings/recordings-project-filter.png" />
    </Frame>
  </Tab>

  <Tab title="By member">
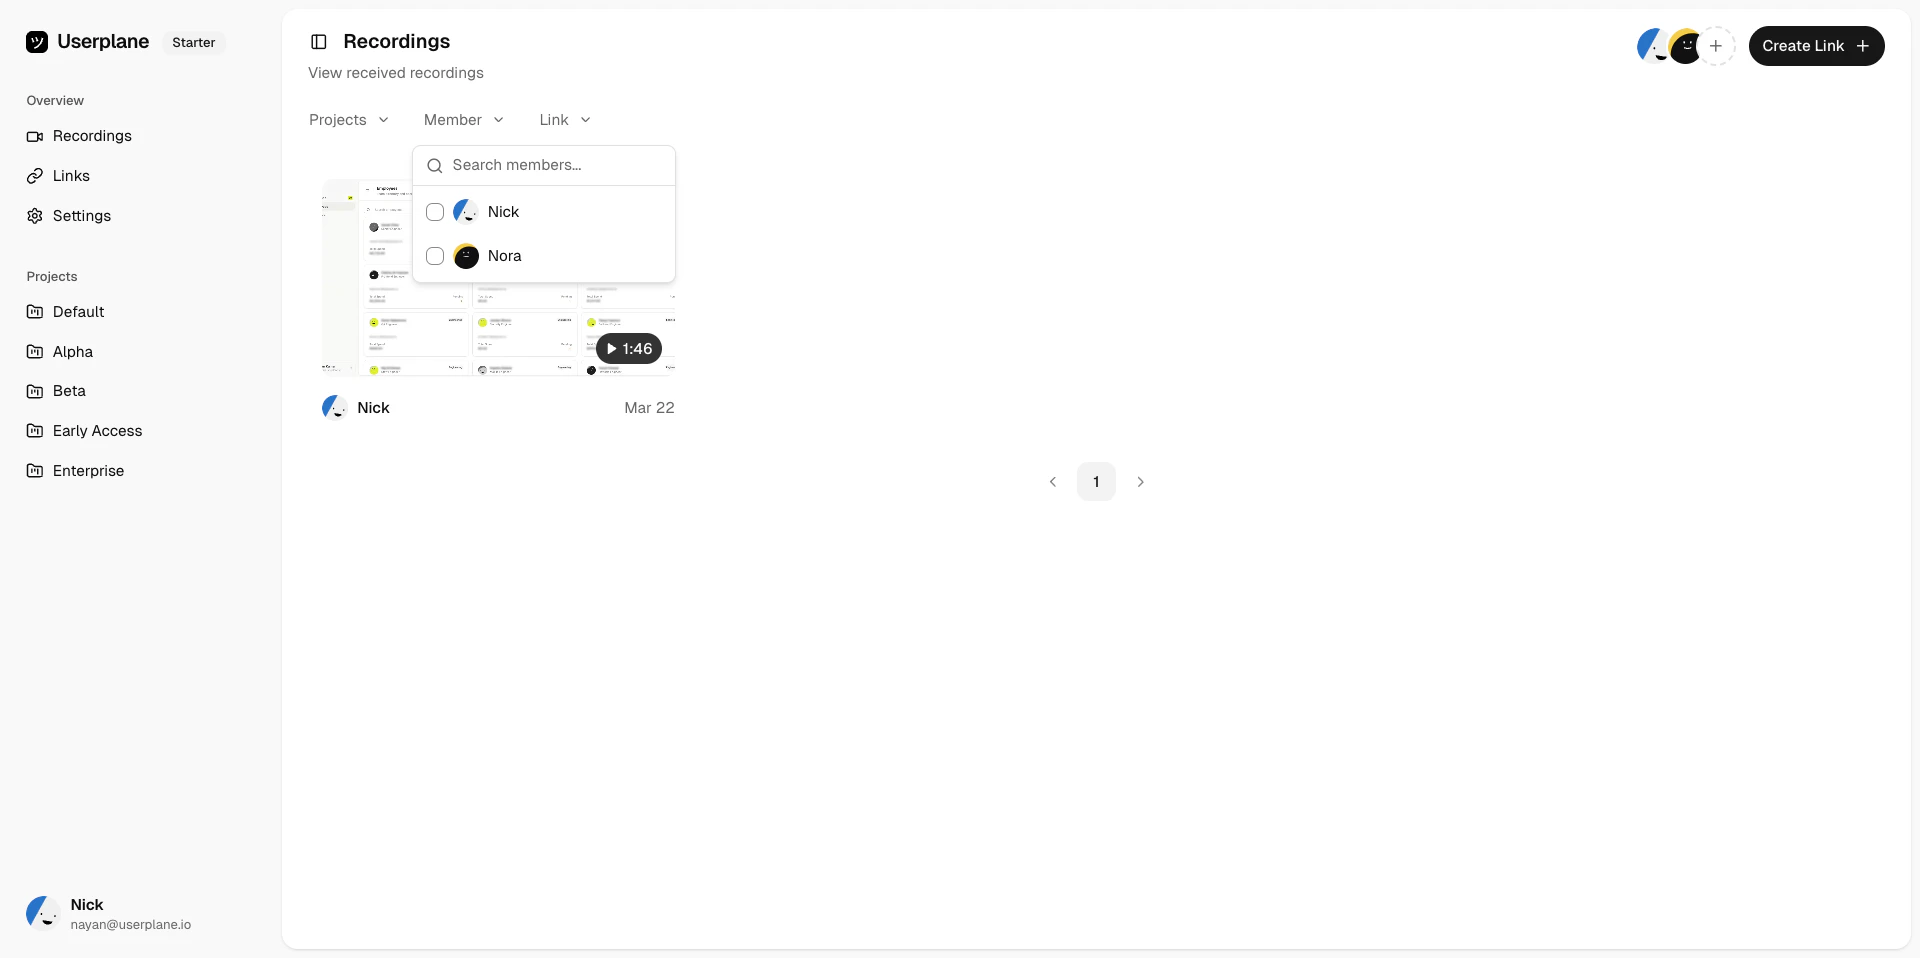
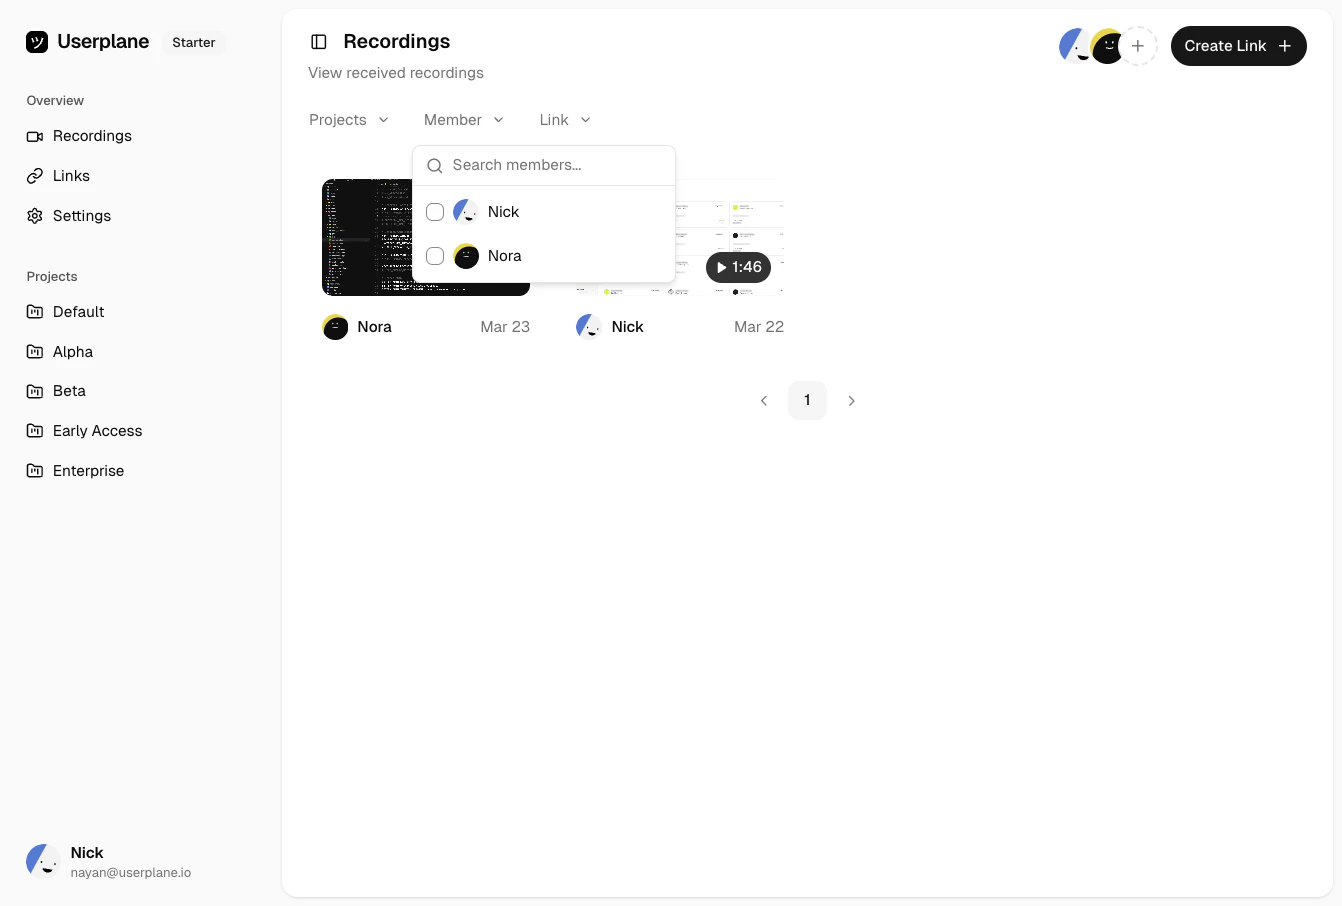
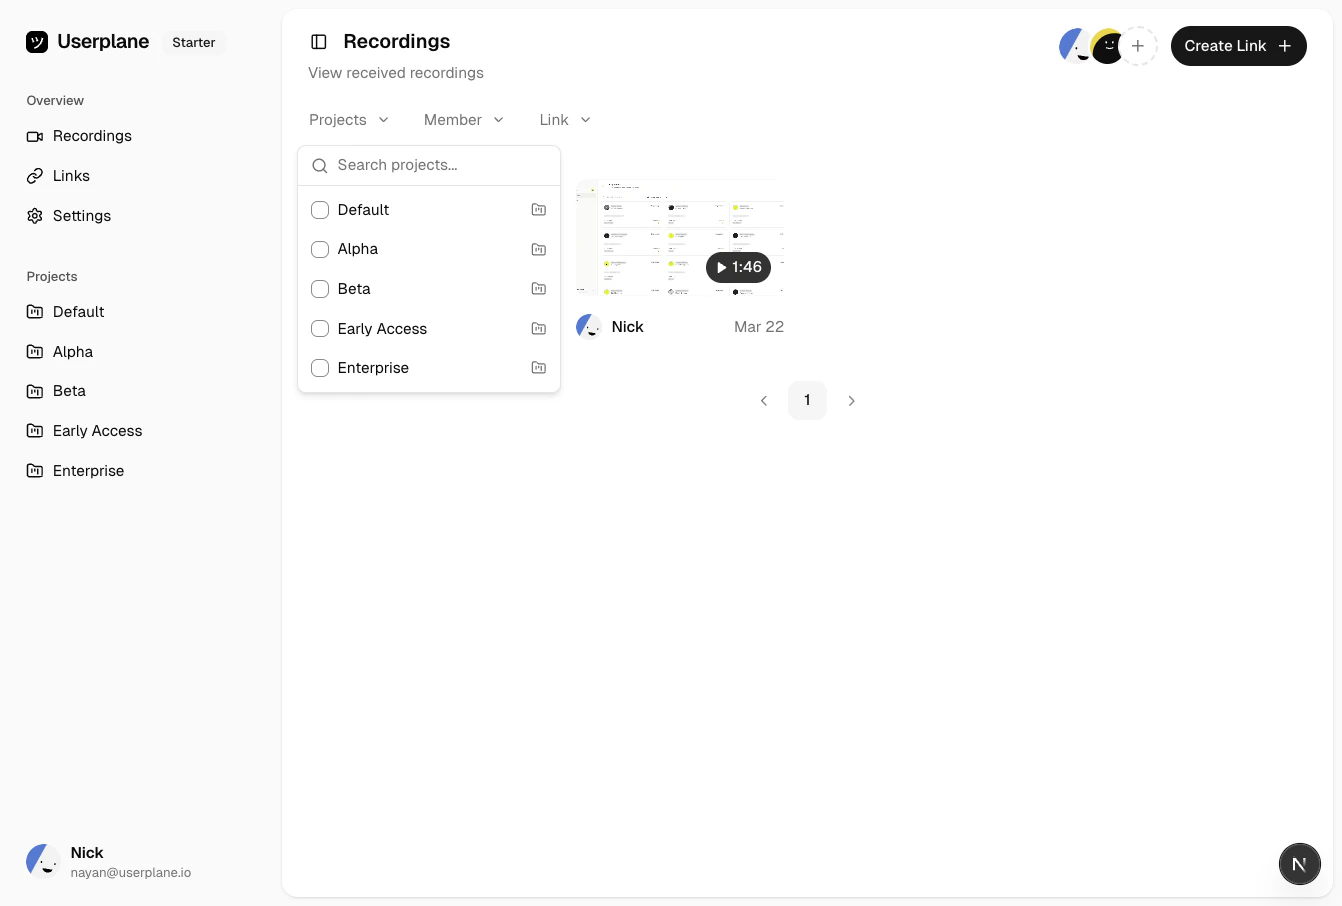
    Show recordings requested by a specific team member.

    <Frame caption="Filter by member">
      <img src="https://mintcdn.com/userplane/IKCB4f_KBaL0xsjW/media/recordings/list-recording/filter-recording-by-creator.png?fit=max&auto=format&n=IKCB4f_KBaL0xsjW&q=85&s=b5c6a5b6c311a28ea65238805df7635c" width="1920" height="958" data-path="media/recordings/list-recording/filter-recording-by-creator.png" />
    </Frame>

    <Frame caption="Filter by member">
      <img src="https://mintcdn.com/userplane/IKCB4f_KBaL0xsjW/media/recordings/recordings-member-filter.png?fit=max&auto=format&n=IKCB4f_KBaL0xsjW&q=85&s=c877e31c05b0071be07a00d403b1775e" width="1342" height="906" data-path="media/recordings/recordings-member-filter.png" />
    </Frame>
  </Tab>

  <Tab title="By link">
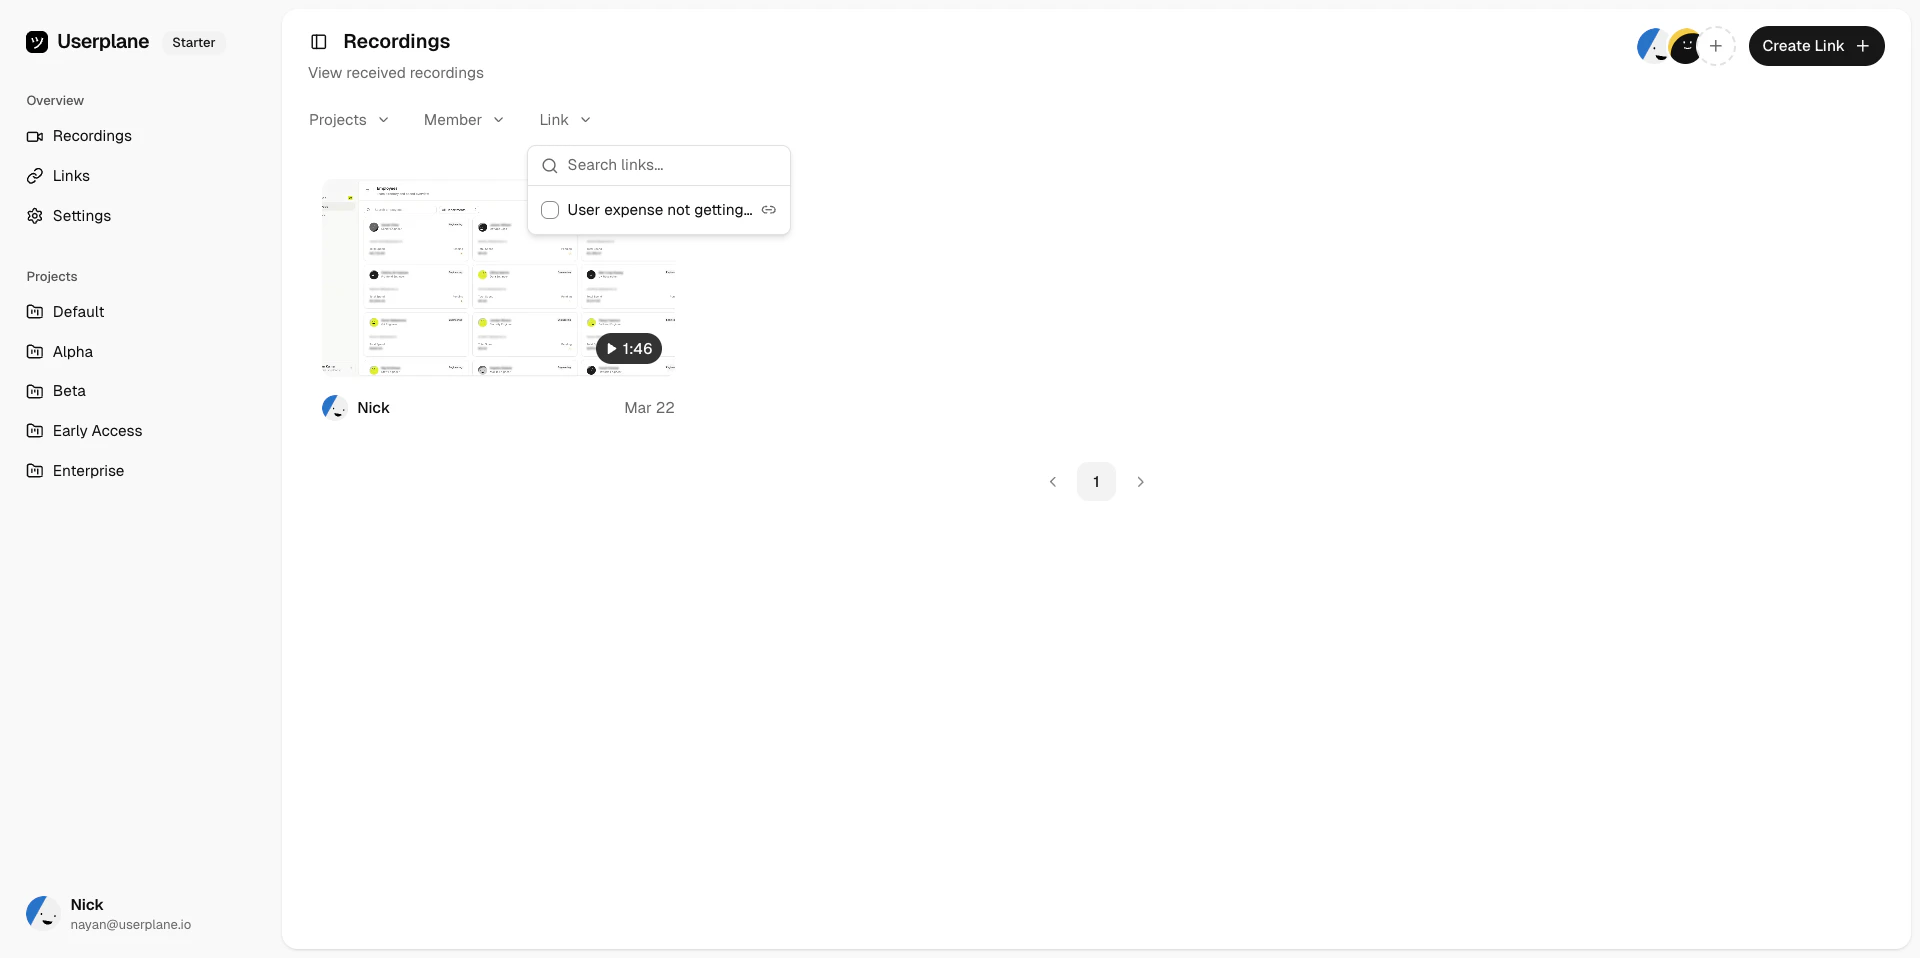
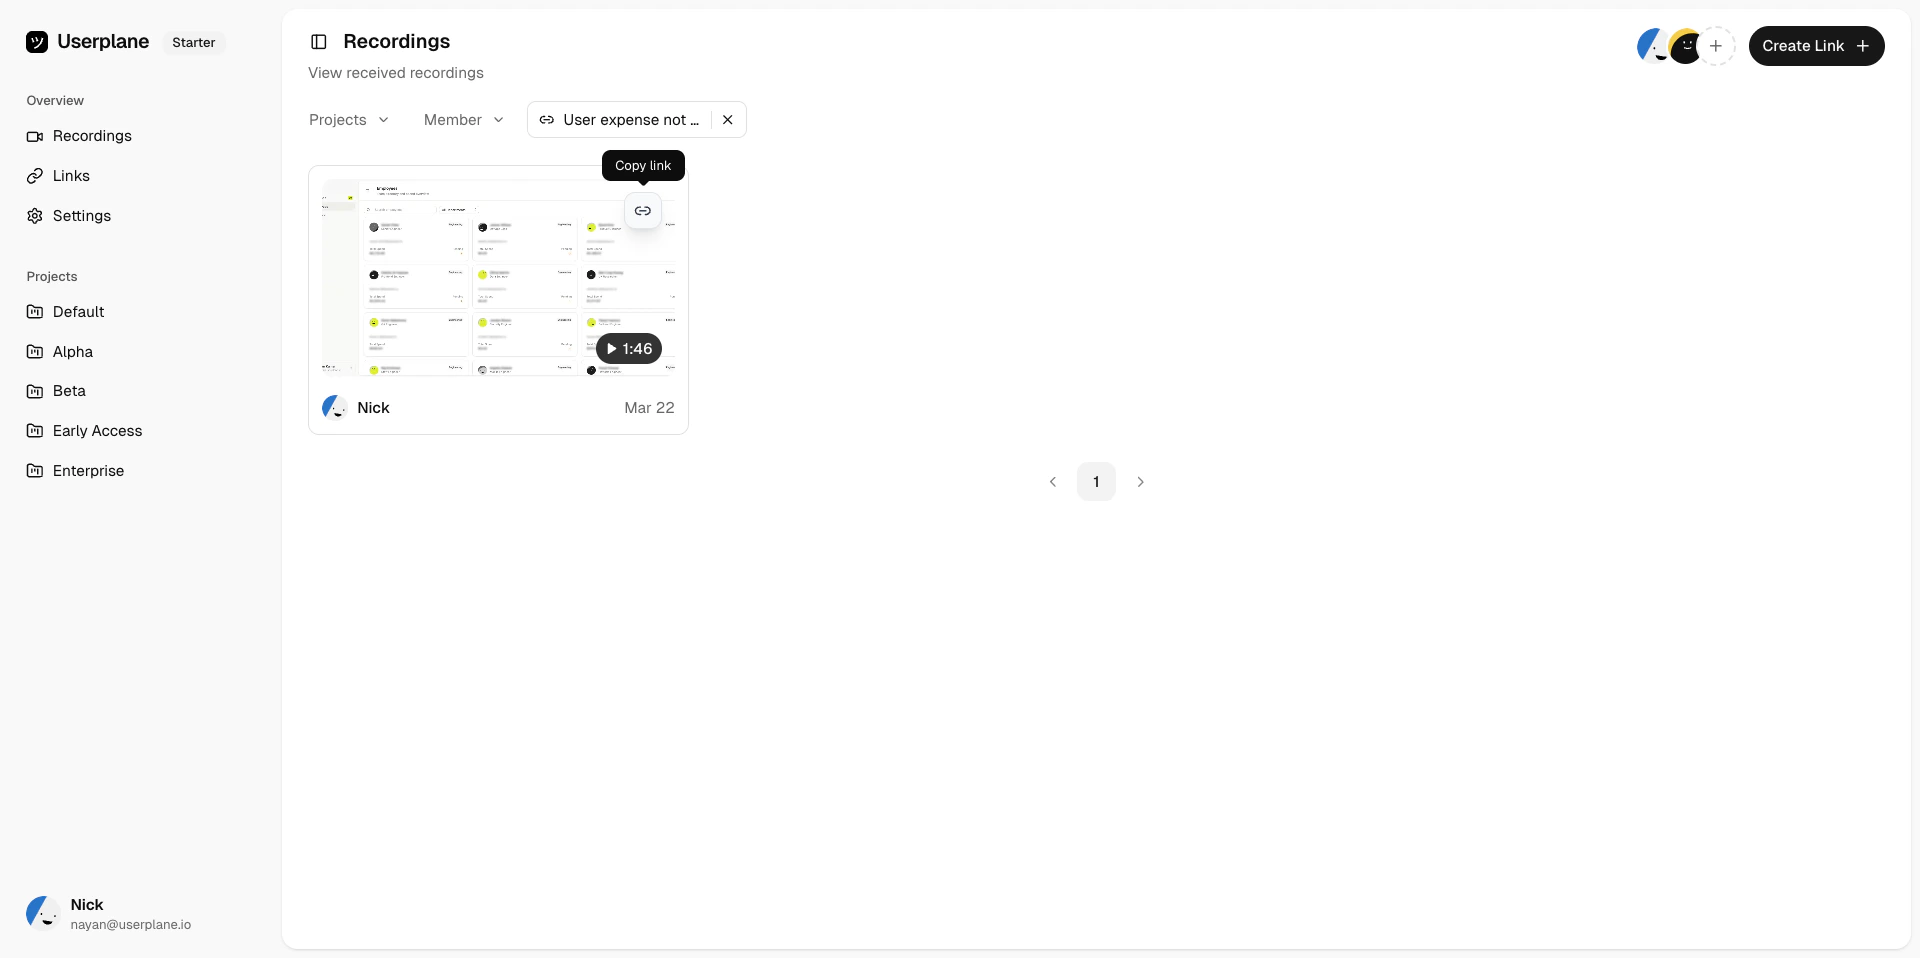
    Show recordings tied to a specific recording link.

    <Frame caption="Filter by link">
      <img src="https://mintcdn.com/userplane/IKCB4f_KBaL0xsjW/media/recordings/list-recording/filter-recording-by-link.png?fit=max&auto=format&n=IKCB4f_KBaL0xsjW&q=85&s=50115ad31103741d52d326cac9ba28af" width="1920" height="958" data-path="media/recordings/list-recording/filter-recording-by-link.png" />
    </Frame>

    <Frame caption="Filtered recordings">
      <img src="https://mintcdn.com/userplane/IKCB4f_KBaL0xsjW/media/recordings/list-recording/filtered-recording-by-link.png?fit=max&auto=format&n=IKCB4f_KBaL0xsjW&q=85&s=a043fed464cb0bab9a06d401eea7a36f" width="1920" height="958" data-path="media/recordings/list-recording/filtered-recording-by-link.png" />
    </Frame>
  </Tab>

  <Tab title="List view">
    Switch to the list view for a compact, scannable layout of your recordings.

    <Frame caption="Recordings list view">
      <img src="https://mintcdn.com/userplane/IKCB4f_KBaL0xsjW/media/recordings/list-recording/list-recordings-view-alt.png?fit=max&auto=format&n=IKCB4f_KBaL0xsjW&q=85&s=3b5b8fb8060f5a258ddf484288f758b0" width="1920" height="959" data-path="media/recordings/list-recording/list-recordings-view-alt.png" />
    </Frame>
  </Tab>
</Tabs>

## Sorting

Sort recordings by date to see the most recent first, or adjust the sort order based on your workflow.
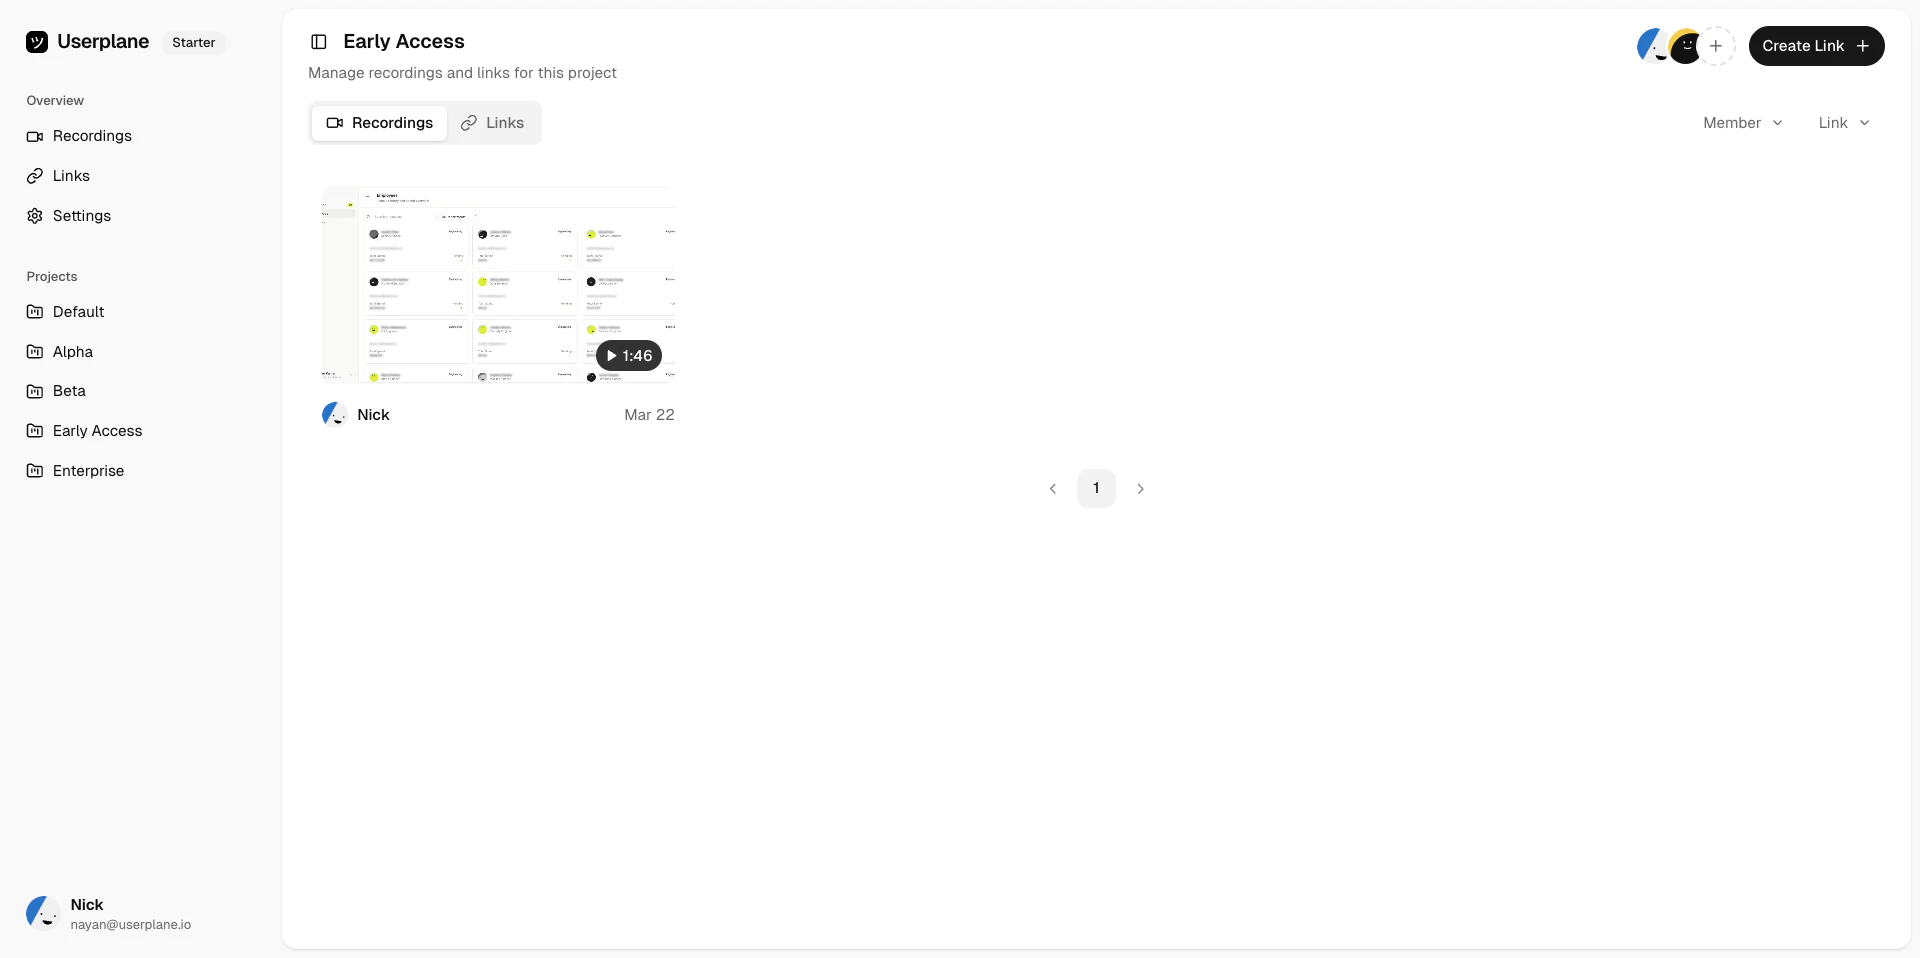
## Project views

Switch to a project-scoped view to see all recordings and links for a single project in one place.
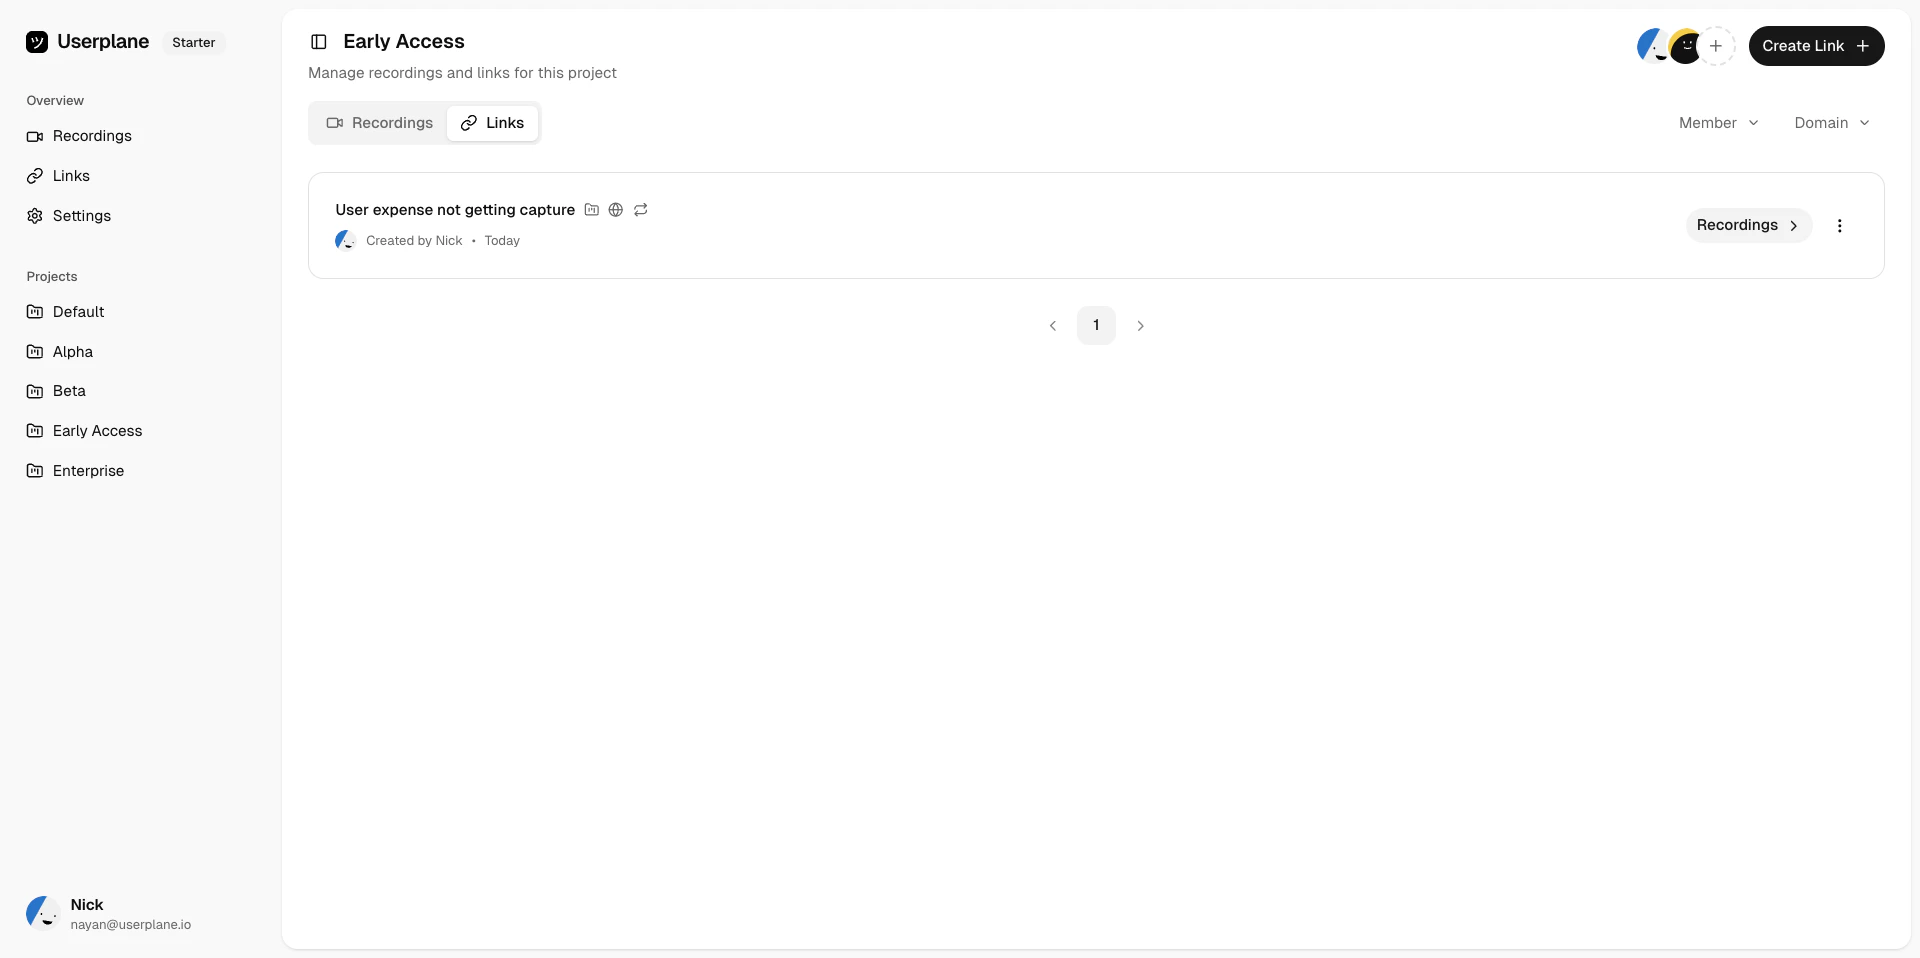
<Frame caption="Project recordings">
  <img src="https://mintcdn.com/userplane/IKCB4f_KBaL0xsjW/media/projects/view/view-recordings.png?fit=max&auto=format&n=IKCB4f_KBaL0xsjW&q=85&s=11374592dfef2f2111d1a4a25c0c6fd1" width="1920" height="958" data-path="media/projects/view/view-recordings.png" />
</Frame>

<Frame caption="Filter recordings within a project">
  <img src="https://mintcdn.com/userplane/IKCB4f_KBaL0xsjW/media/projects/view/view-recordings-filter.png?fit=max&auto=format&n=IKCB4f_KBaL0xsjW&q=85&s=f74d706135370ee93930783089f1a40e" width="1920" height="957" data-path="media/projects/view/view-recordings-filter.png" />
</Frame>

<Frame caption="View a recording link from a project">
  <img src="https://mintcdn.com/userplane/IKCB4f_KBaL0xsjW/media/projects/view/view-recording-link.png?fit=max&auto=format&n=IKCB4f_KBaL0xsjW&q=85&s=f6c3eb3d7c8d881d9dc8947e44d2ca35" width="1920" height="958" data-path="media/projects/view/view-recording-link.png" />
</Frame>

## Pagination

Navigate between pages using the pagination controls at the bottom of the grid. Each page displays up to 16 recordings.
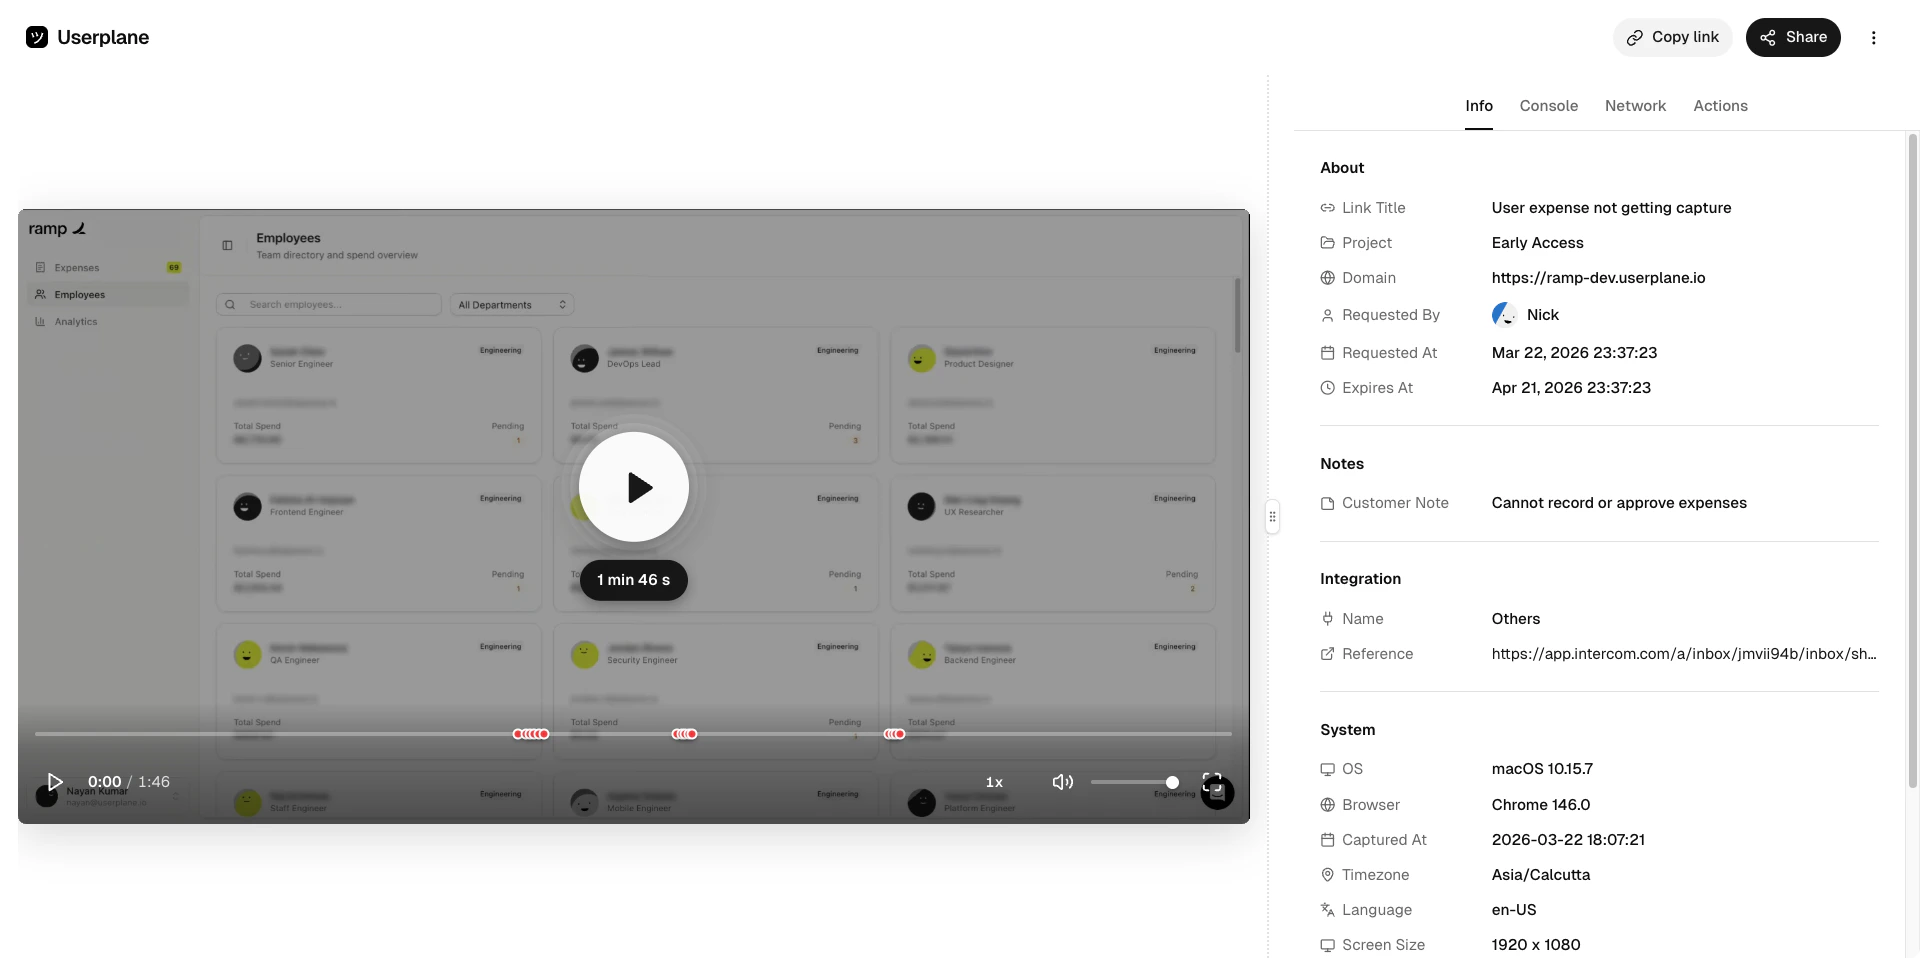
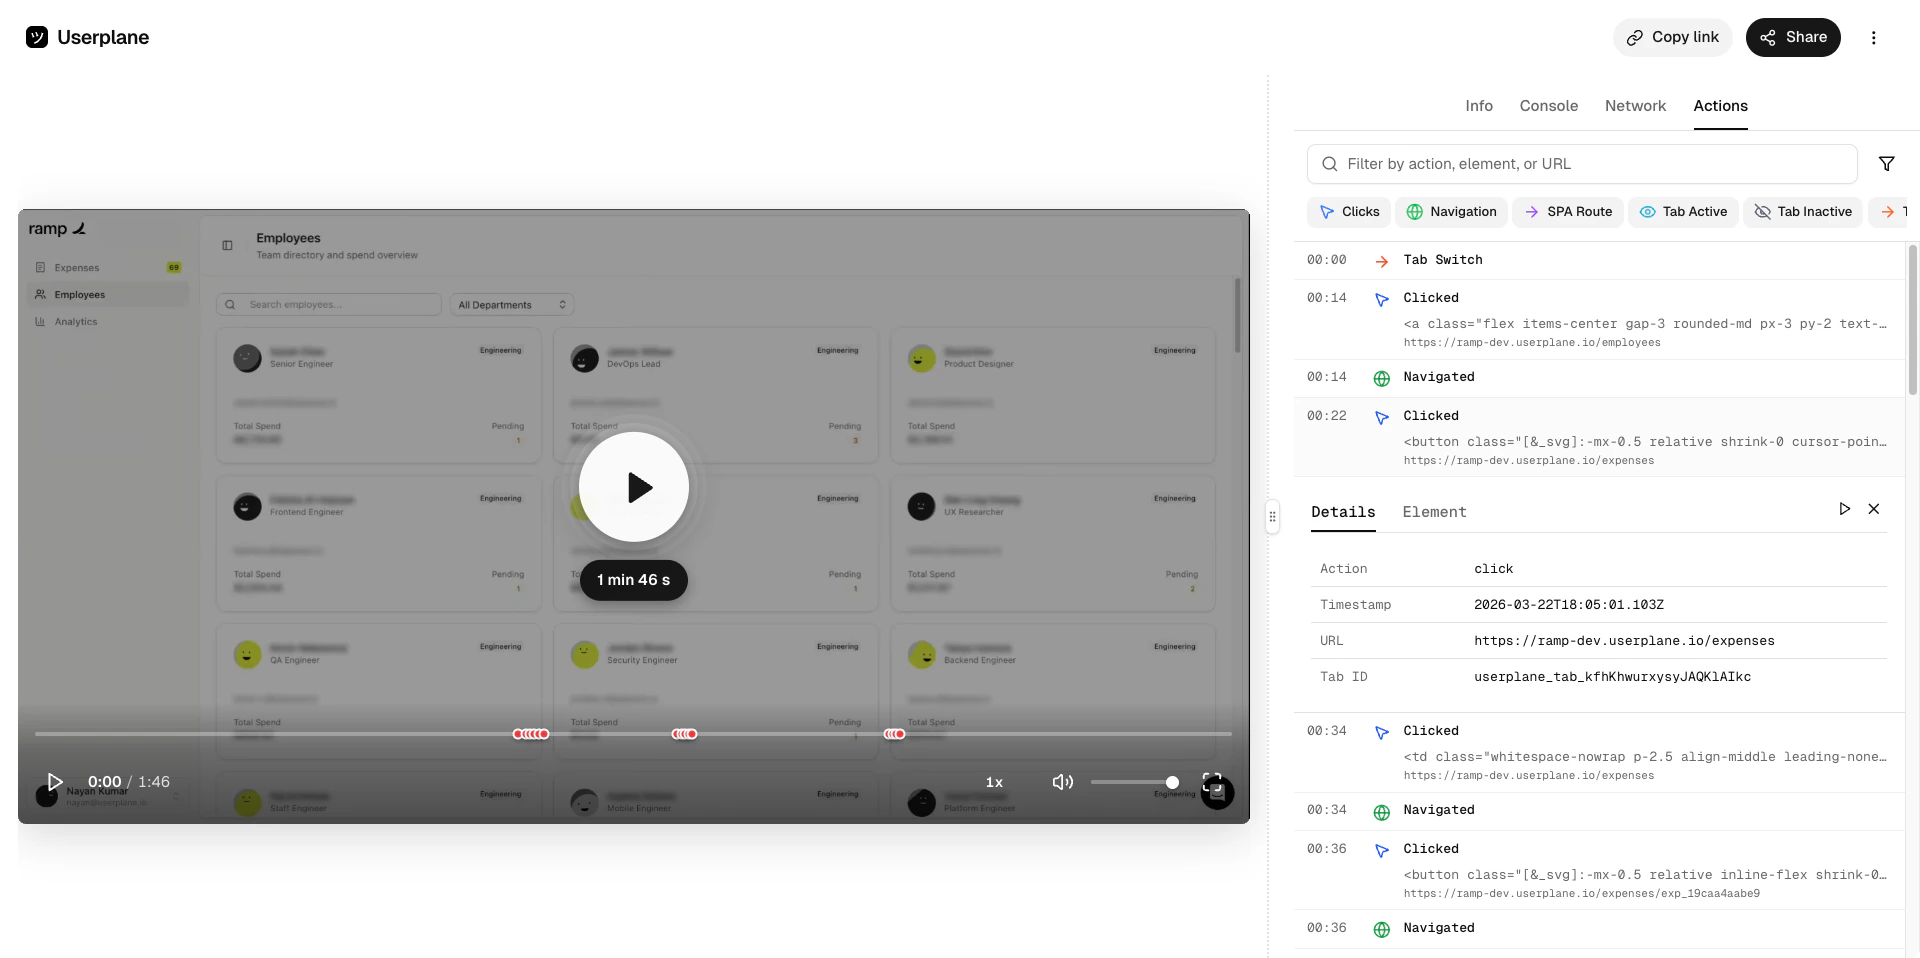
## Opening a recording

Click any recording card to open the [recording playback](/recording/playback) detail view, where you can watch the video and inspect the captured data.

<Frame caption="Recording playback">
  <img src="https://mintcdn.com/userplane/iHJrxtyvOmNXmfMS/media/playback/media/player-playback-screen.png?fit=max&auto=format&n=iHJrxtyvOmNXmfMS&q=85&s=34d146eb3b51ce95c95bfe81f72e50b3" width="1920" height="958" data-path="media/playback/media/player-playback-screen.png" />
</Frame>

<Tabs>
  <Tab title="Console">
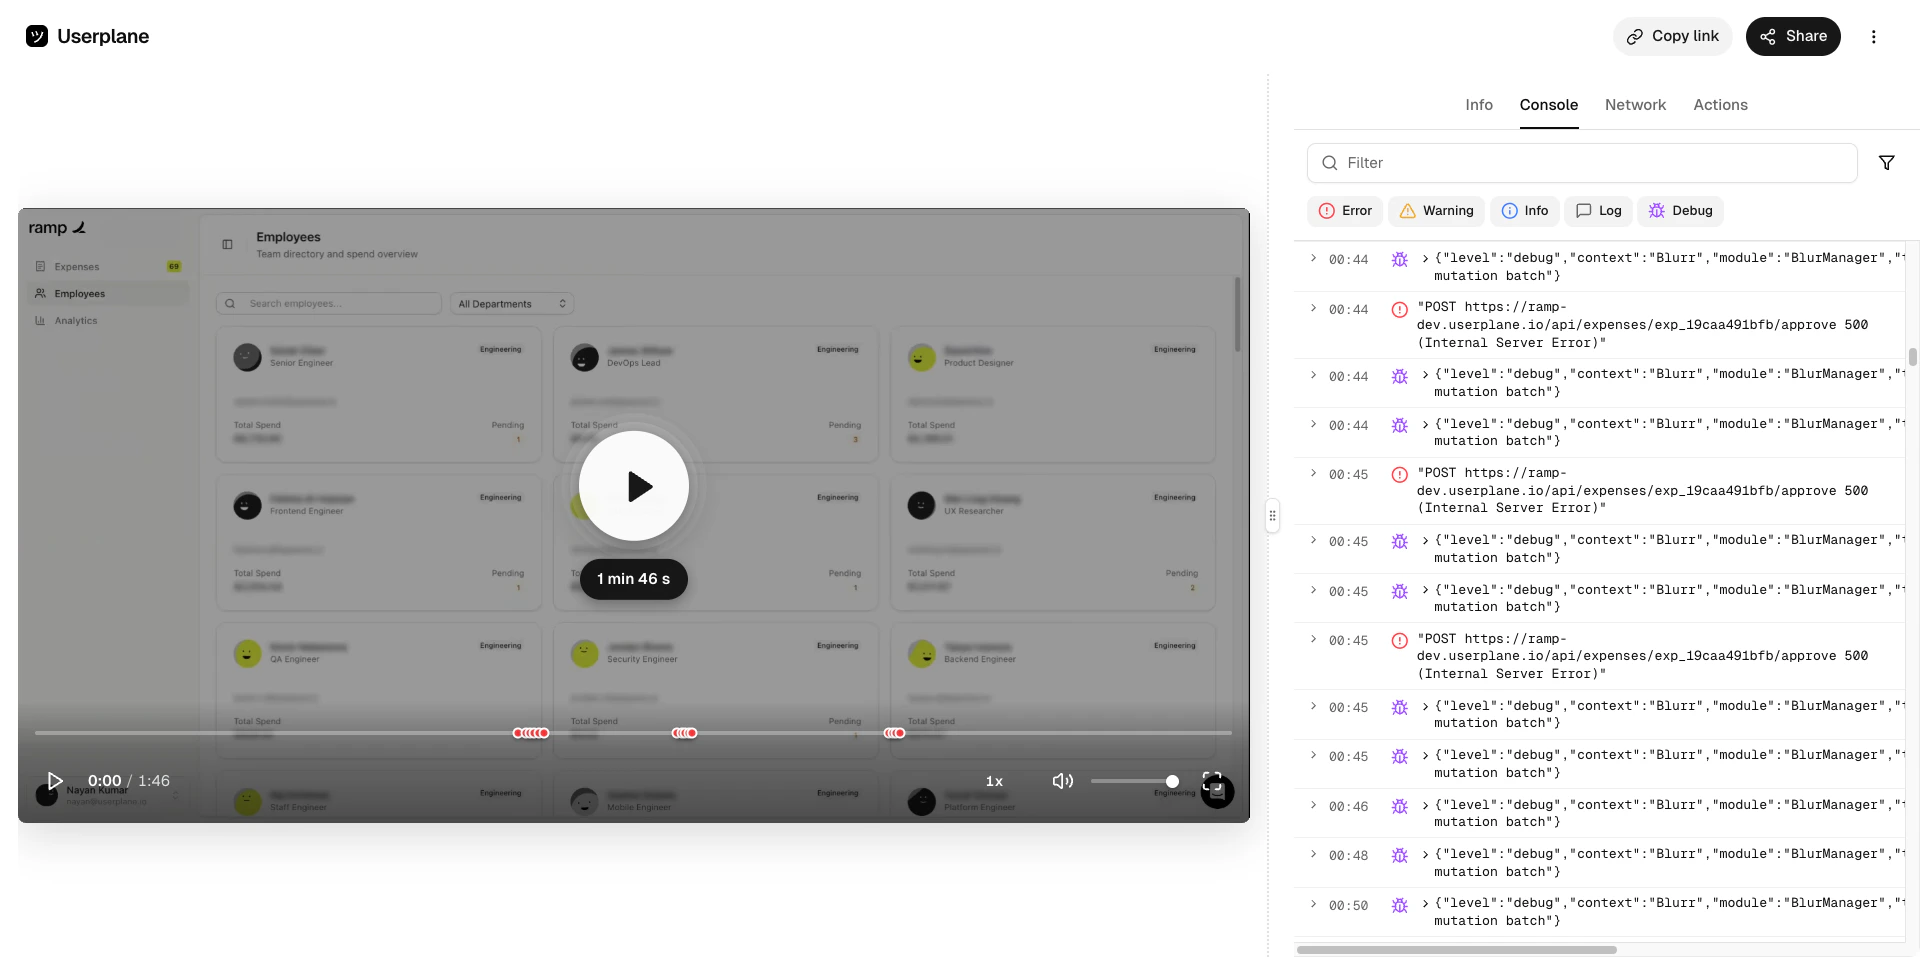
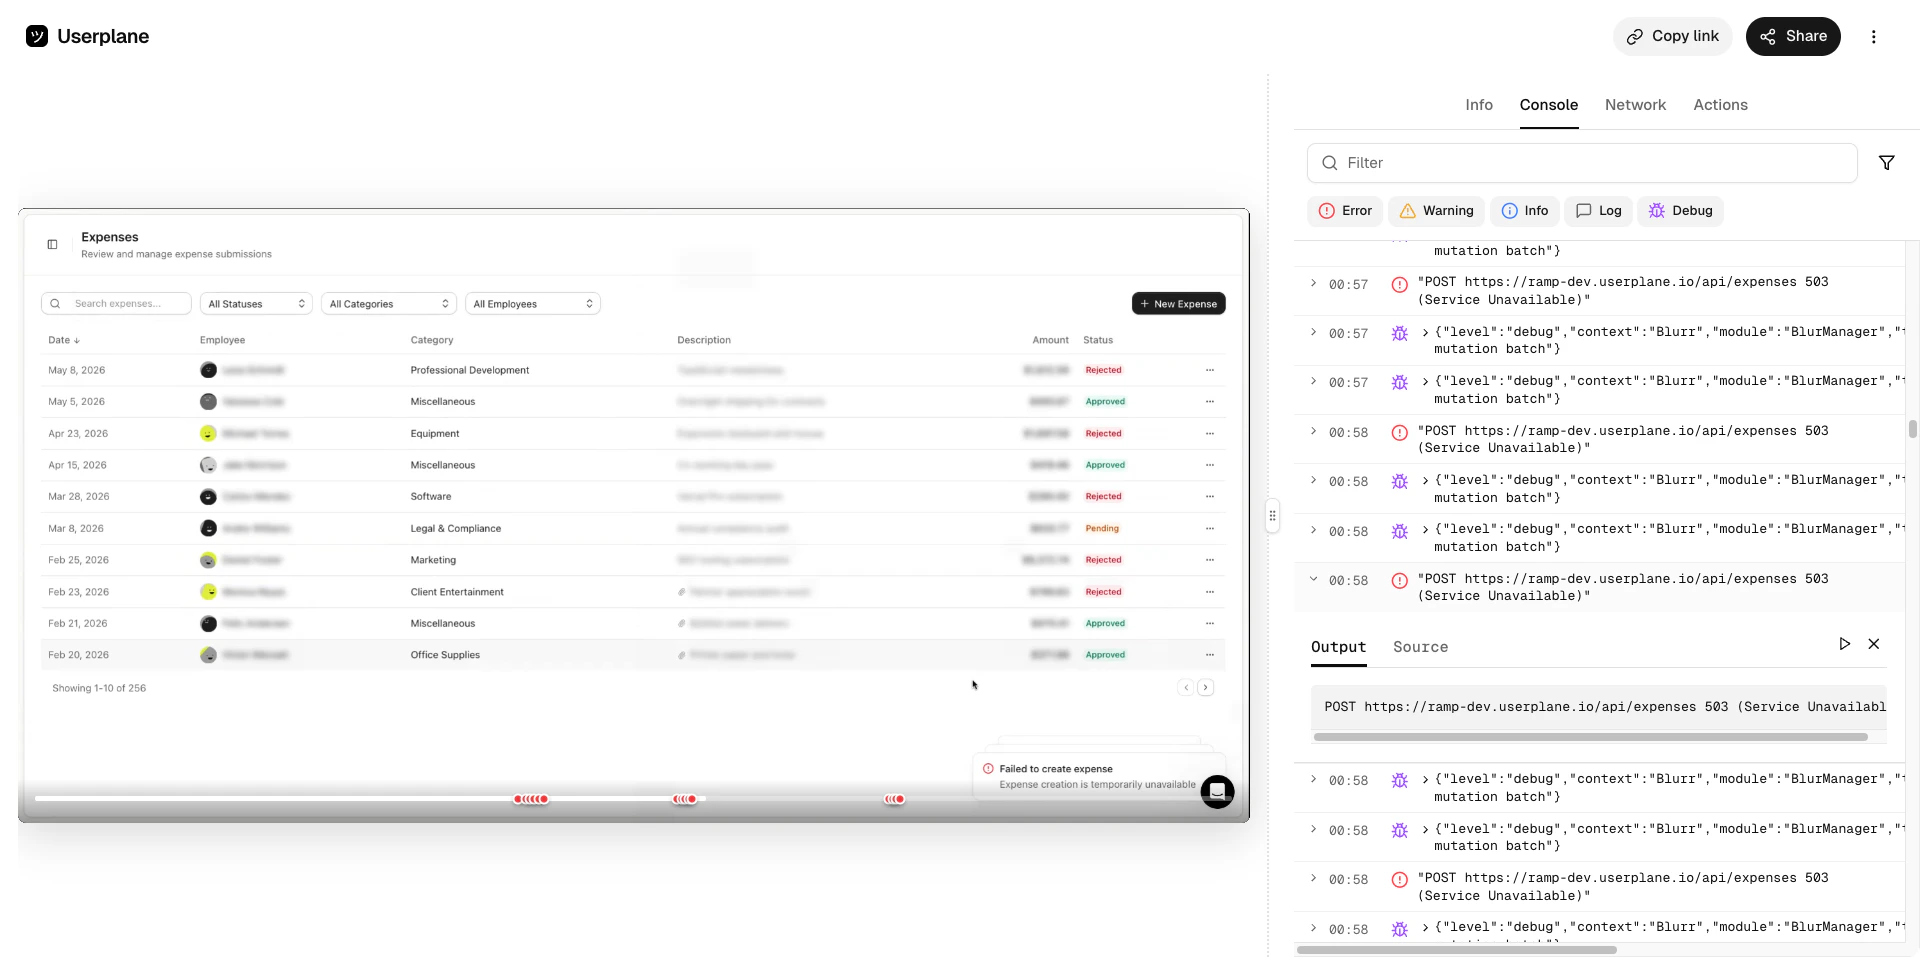
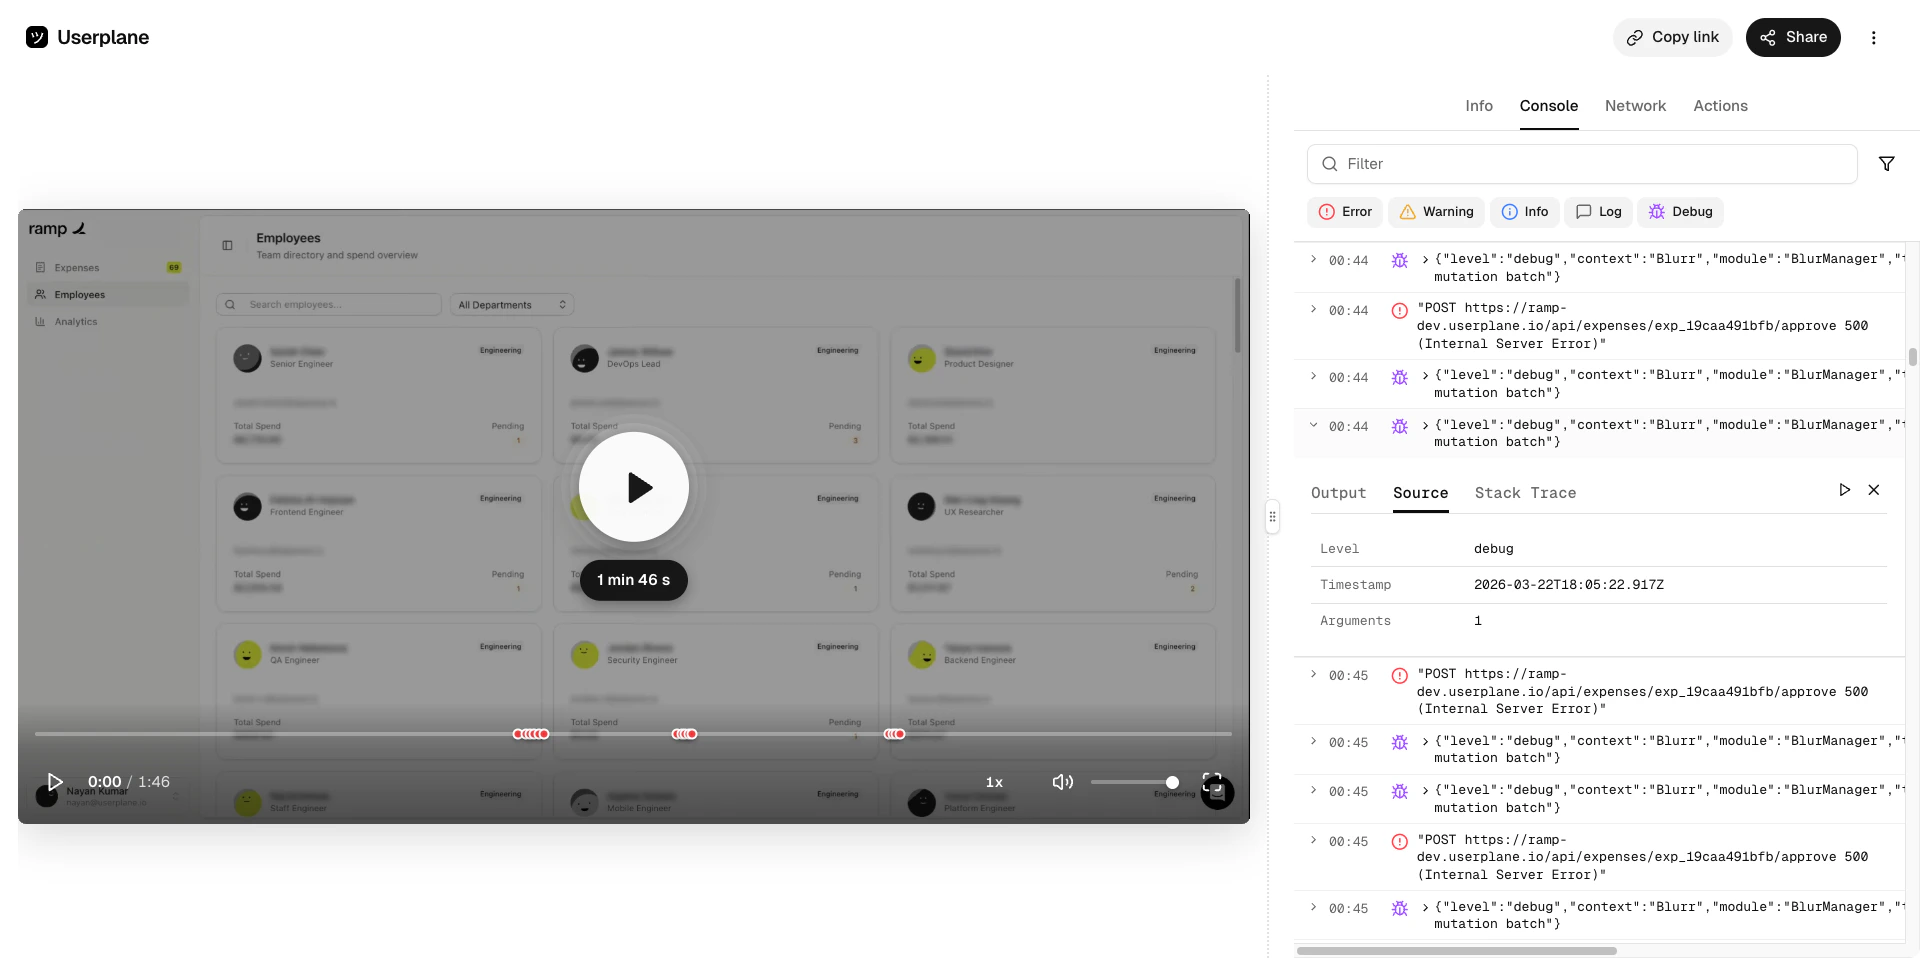
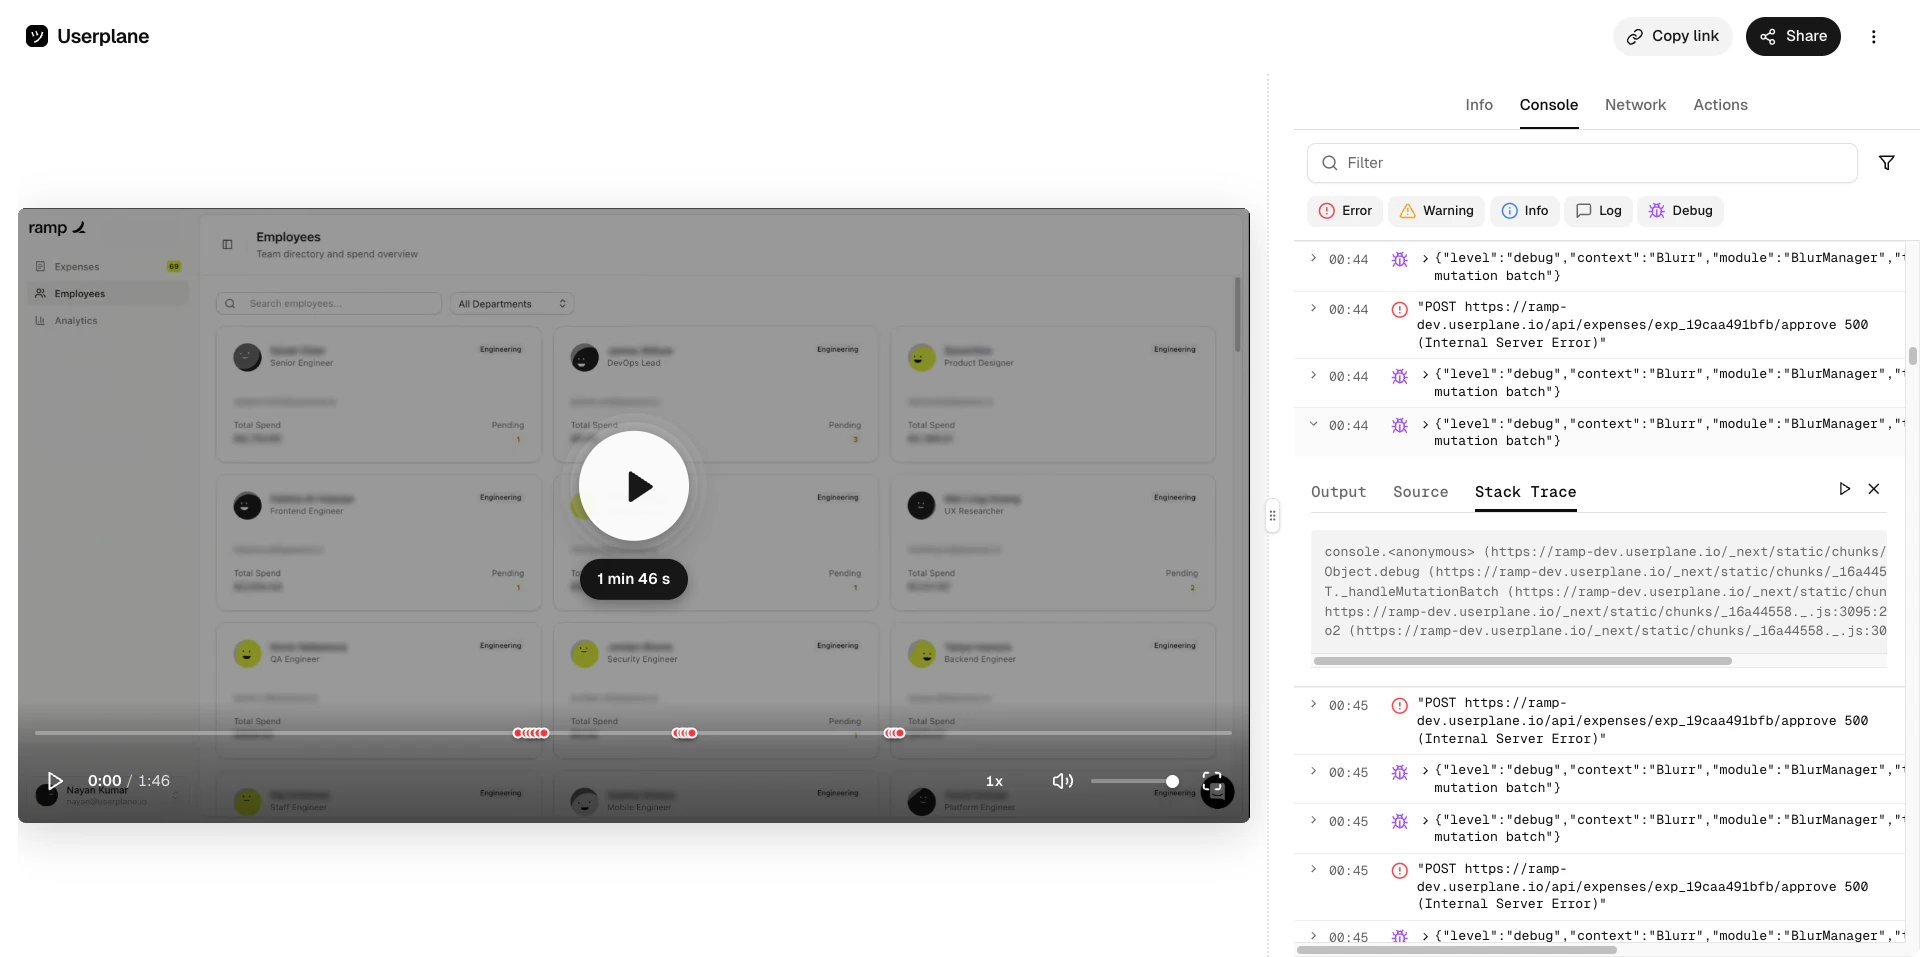
    Inspect captured browser console logs — errors, warnings, and debug messages — with full output, source location, and stack traces.

    <Frame caption="Console log list">
      <img src="https://mintcdn.com/userplane/iHJrxtyvOmNXmfMS/media/playback/console/console-list-view.png?fit=max&auto=format&n=iHJrxtyvOmNXmfMS&q=85&s=92504dd28ee4f6b7c76fae7e51123cfe" width="1920" height="957" data-path="media/playback/console/console-list-view.png" />
    </Frame>

    <Frame caption="Console error detail">
      <img src="https://mintcdn.com/userplane/iHJrxtyvOmNXmfMS/media/playback/console/console-error-detail-view-output.png?fit=max&auto=format&n=iHJrxtyvOmNXmfMS&q=85&s=5bd6612ce88cbe4873ece60067d88a09" width="1920" height="957" data-path="media/playback/console/console-error-detail-view-output.png" />
    </Frame>

    <Frame caption="Console debug source">
      <img src="https://mintcdn.com/userplane/iHJrxtyvOmNXmfMS/media/playback/console/console-debug-detail-view-source.png?fit=max&auto=format&n=iHJrxtyvOmNXmfMS&q=85&s=117d8379184b9dec985e18c0b4e81f80" width="1920" height="958" data-path="media/playback/console/console-debug-detail-view-source.png" />
    </Frame>

    <Frame caption="Console debug stack trace">
      <img src="https://mintcdn.com/userplane/iHJrxtyvOmNXmfMS/media/playback/console/console-debug-detail-view-stack-trace.png?fit=max&auto=format&n=iHJrxtyvOmNXmfMS&q=85&s=3e0683254bc2f071ddc0344b5f85c342" width="1920" height="957" data-path="media/playback/console/console-debug-detail-view-stack-trace.png" />
    </Frame>
  </Tab>

  <Tab title="Network">
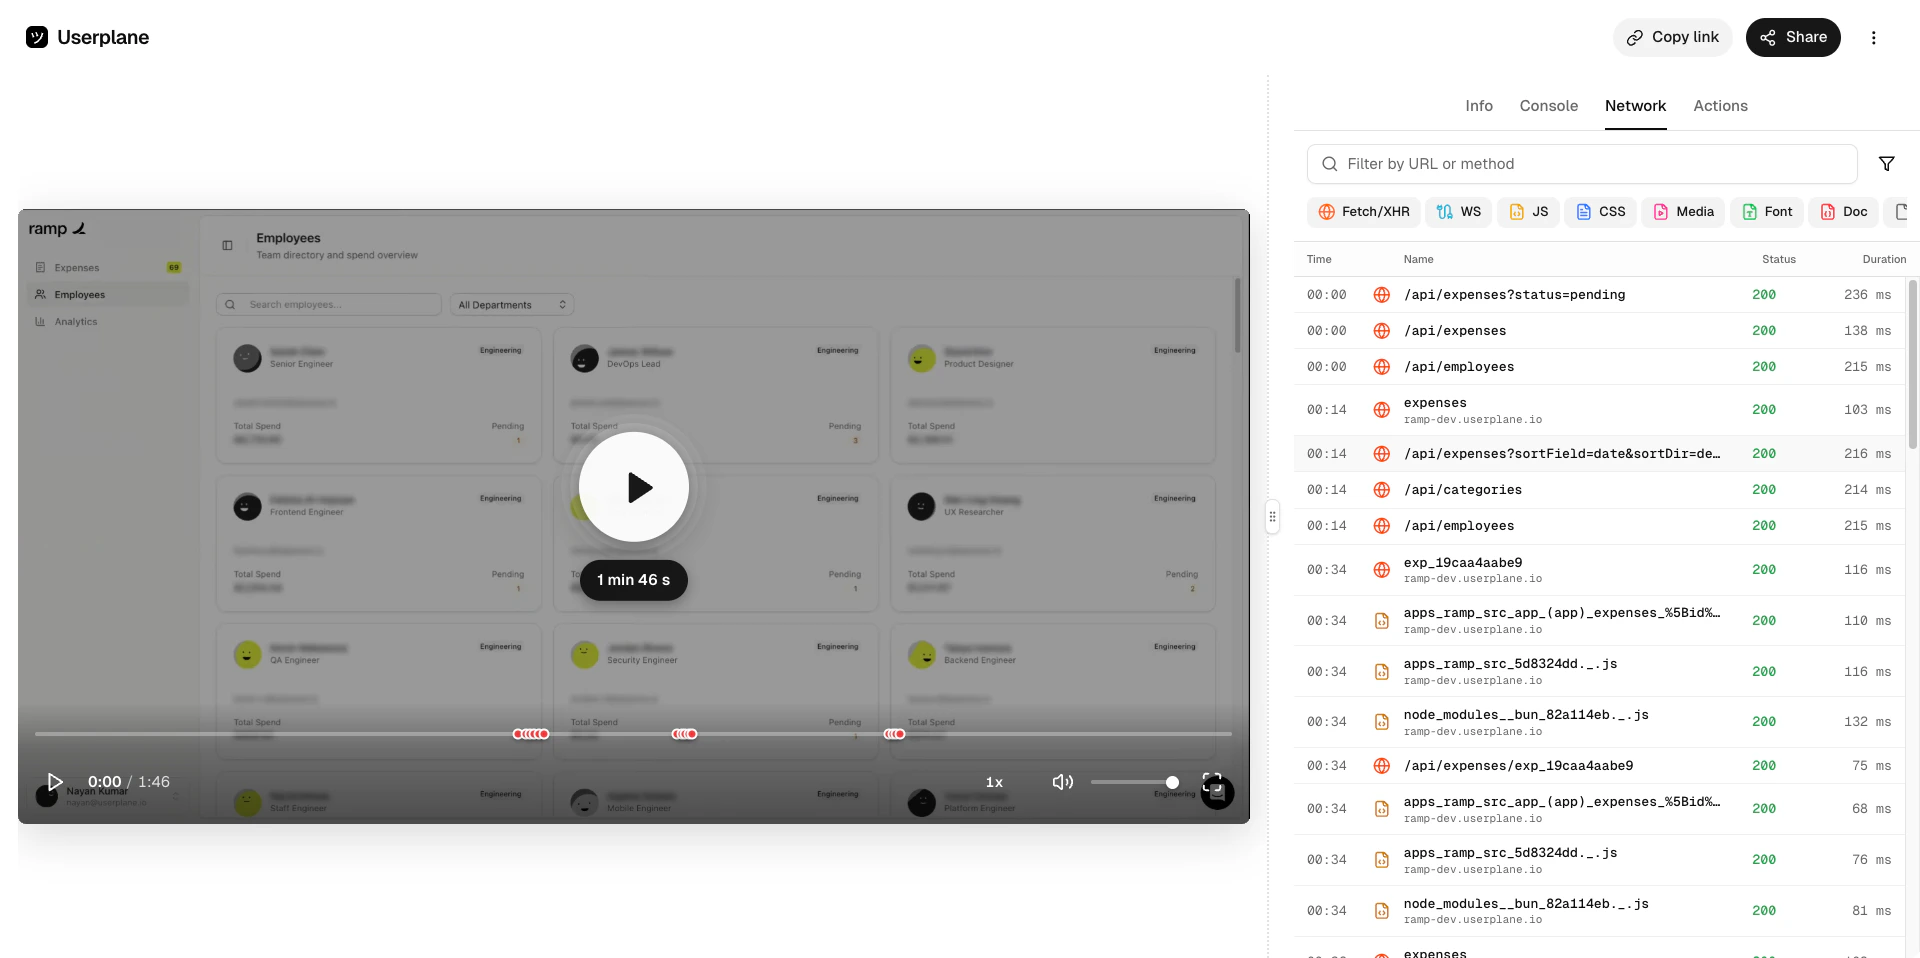
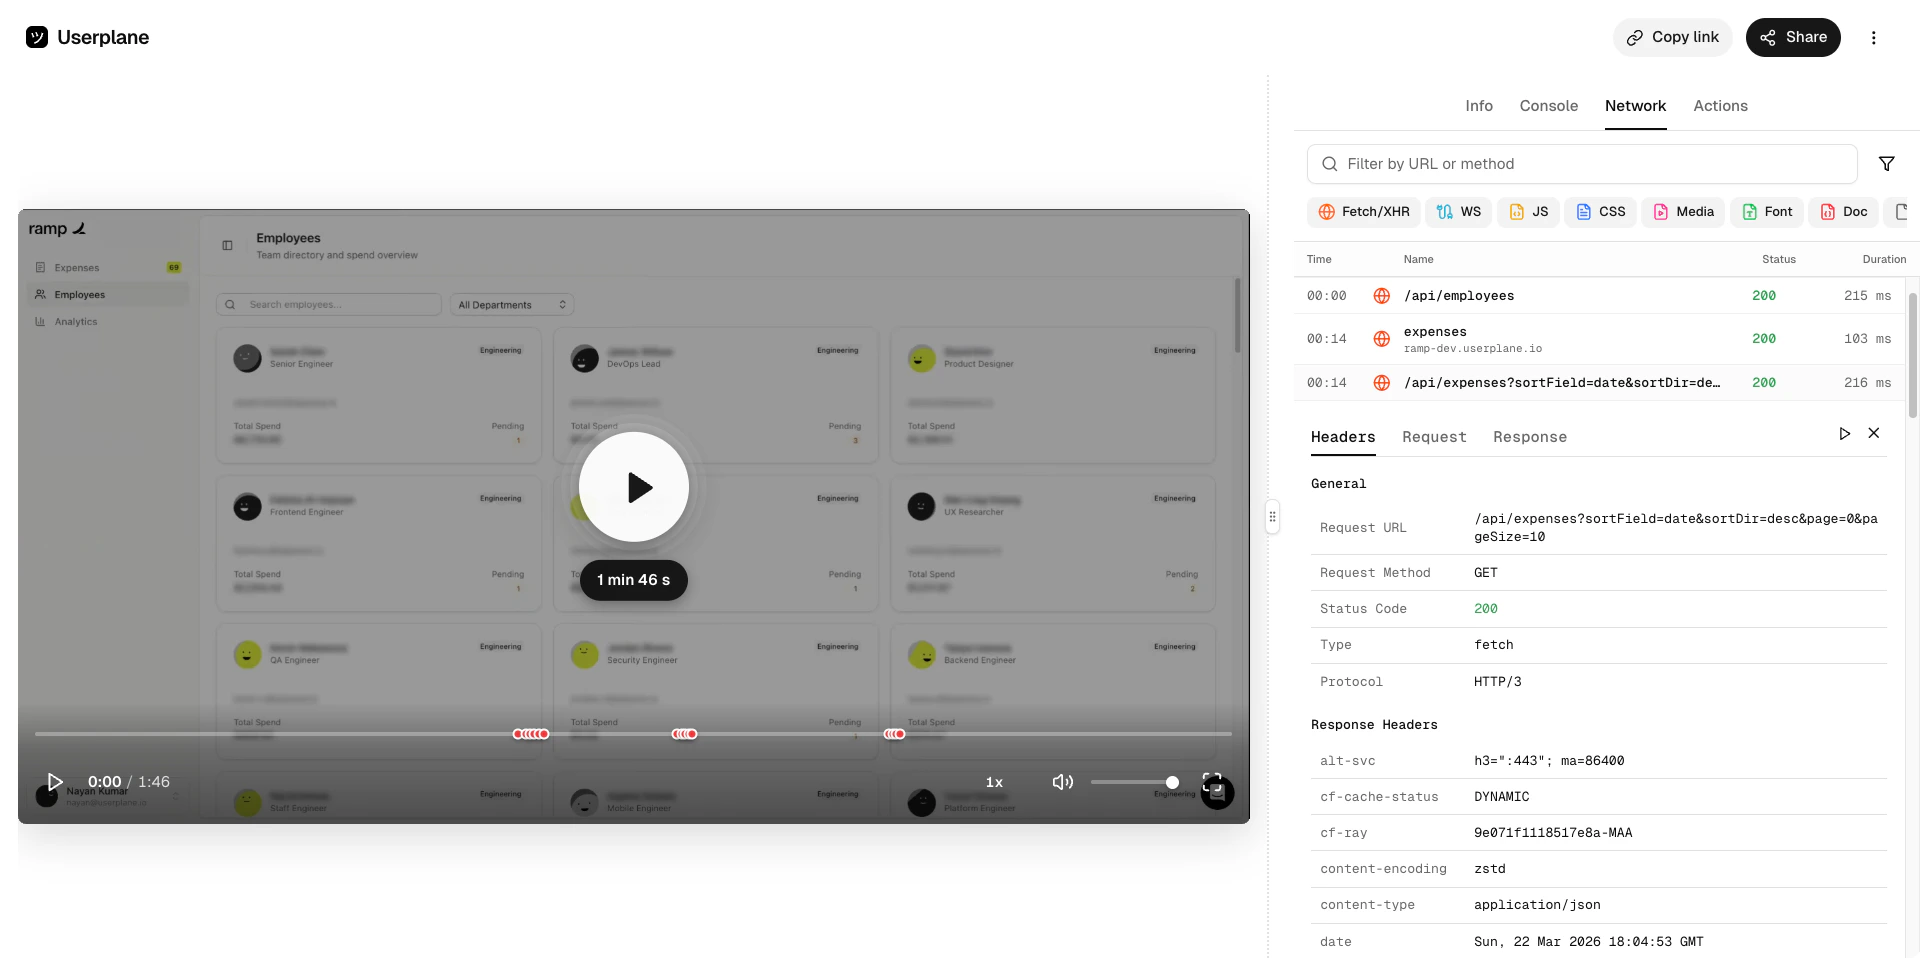
    Review captured network requests and responses — status codes, timing, headers, and payloads.

    <Frame caption="Network request list">
      <img src="https://mintcdn.com/userplane/iHJrxtyvOmNXmfMS/media/playback/network/network-panel-list-view.png?fit=max&auto=format&n=iHJrxtyvOmNXmfMS&q=85&s=a6f970197afe084739ad82a0996fbd99" width="1920" height="958" data-path="media/playback/network/network-panel-list-view.png" />
    </Frame>

    <Frame caption="Network request detail">
      <img src="https://mintcdn.com/userplane/iHJrxtyvOmNXmfMS/media/playback/network/network-panel-detail-view.png?fit=max&auto=format&n=iHJrxtyvOmNXmfMS&q=85&s=eacd608706d0566a77bb48d1d3442473" width="1920" height="958" data-path="media/playback/network/network-panel-detail-view.png" />
    </Frame>
  </Tab>

  <Tab title="Actions">
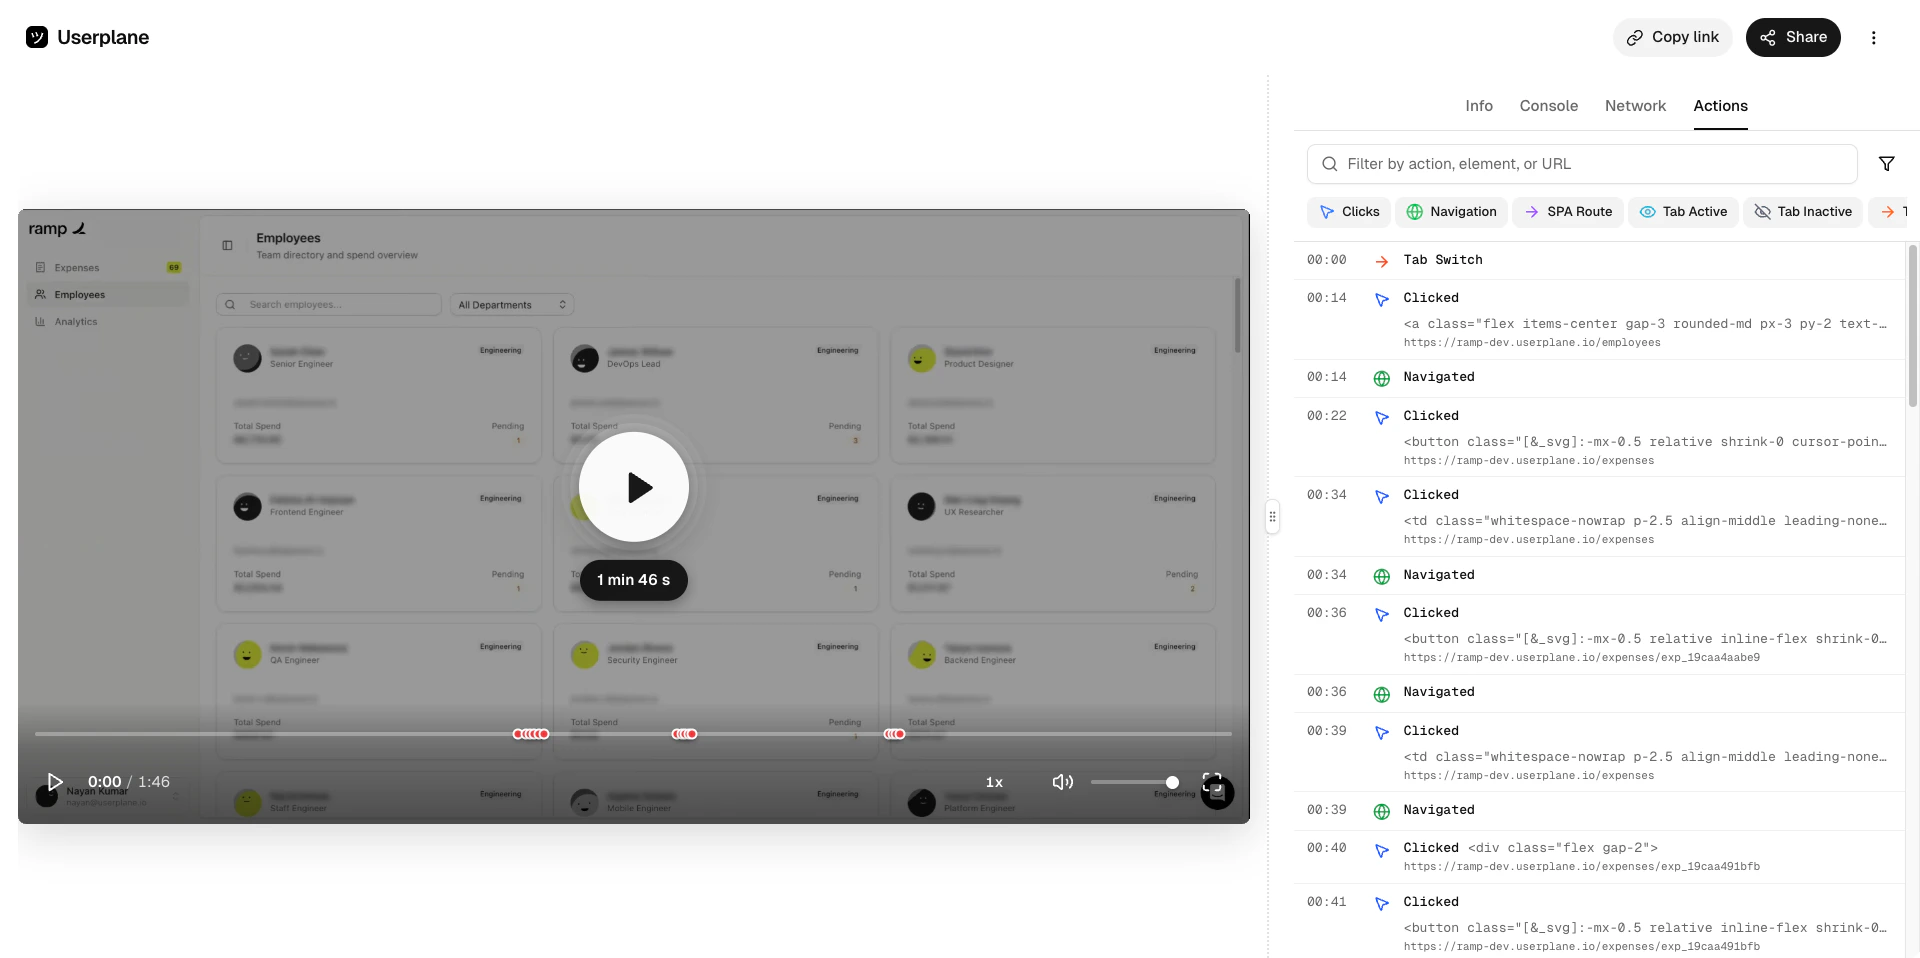
    See the user actions captured during the recording — clicks, navigations, and other interactions.

    <Frame caption="Actions list">
      <img src="https://mintcdn.com/userplane/iHJrxtyvOmNXmfMS/media/playback/actions/actions-list-view.png?fit=max&auto=format&n=iHJrxtyvOmNXmfMS&q=85&s=648d0c27d24049f06610735f8bbfe212" width="1920" height="958" data-path="media/playback/actions/actions-list-view.png" />
    </Frame>

    <Frame caption="Action detail">
      <img src="https://mintcdn.com/userplane/iHJrxtyvOmNXmfMS/media/playback/actions/actions-detail-view.png?fit=max&auto=format&n=iHJrxtyvOmNXmfMS&q=85&s=92e11d966784c89f2f7af8fac04b093a" width="1920" height="958" data-path="media/playback/actions/actions-detail-view.png" />
    </Frame>
  </Tab>

  <Tab title="Info">
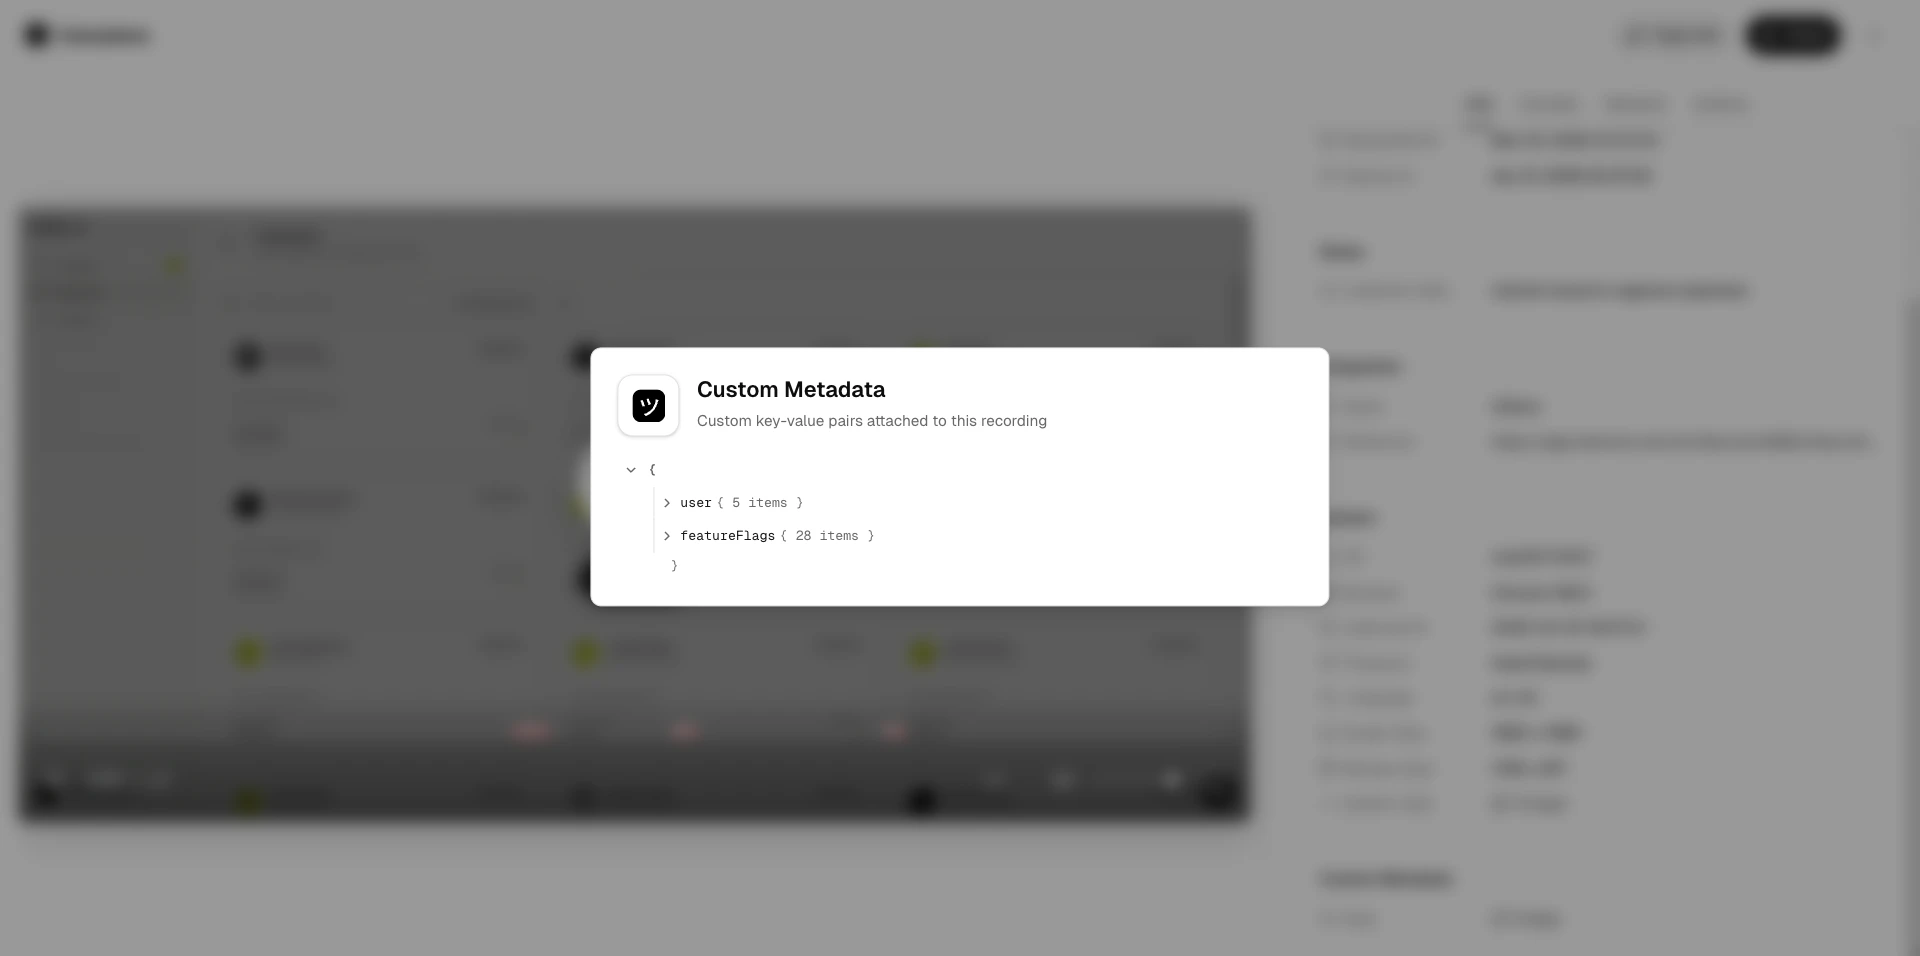
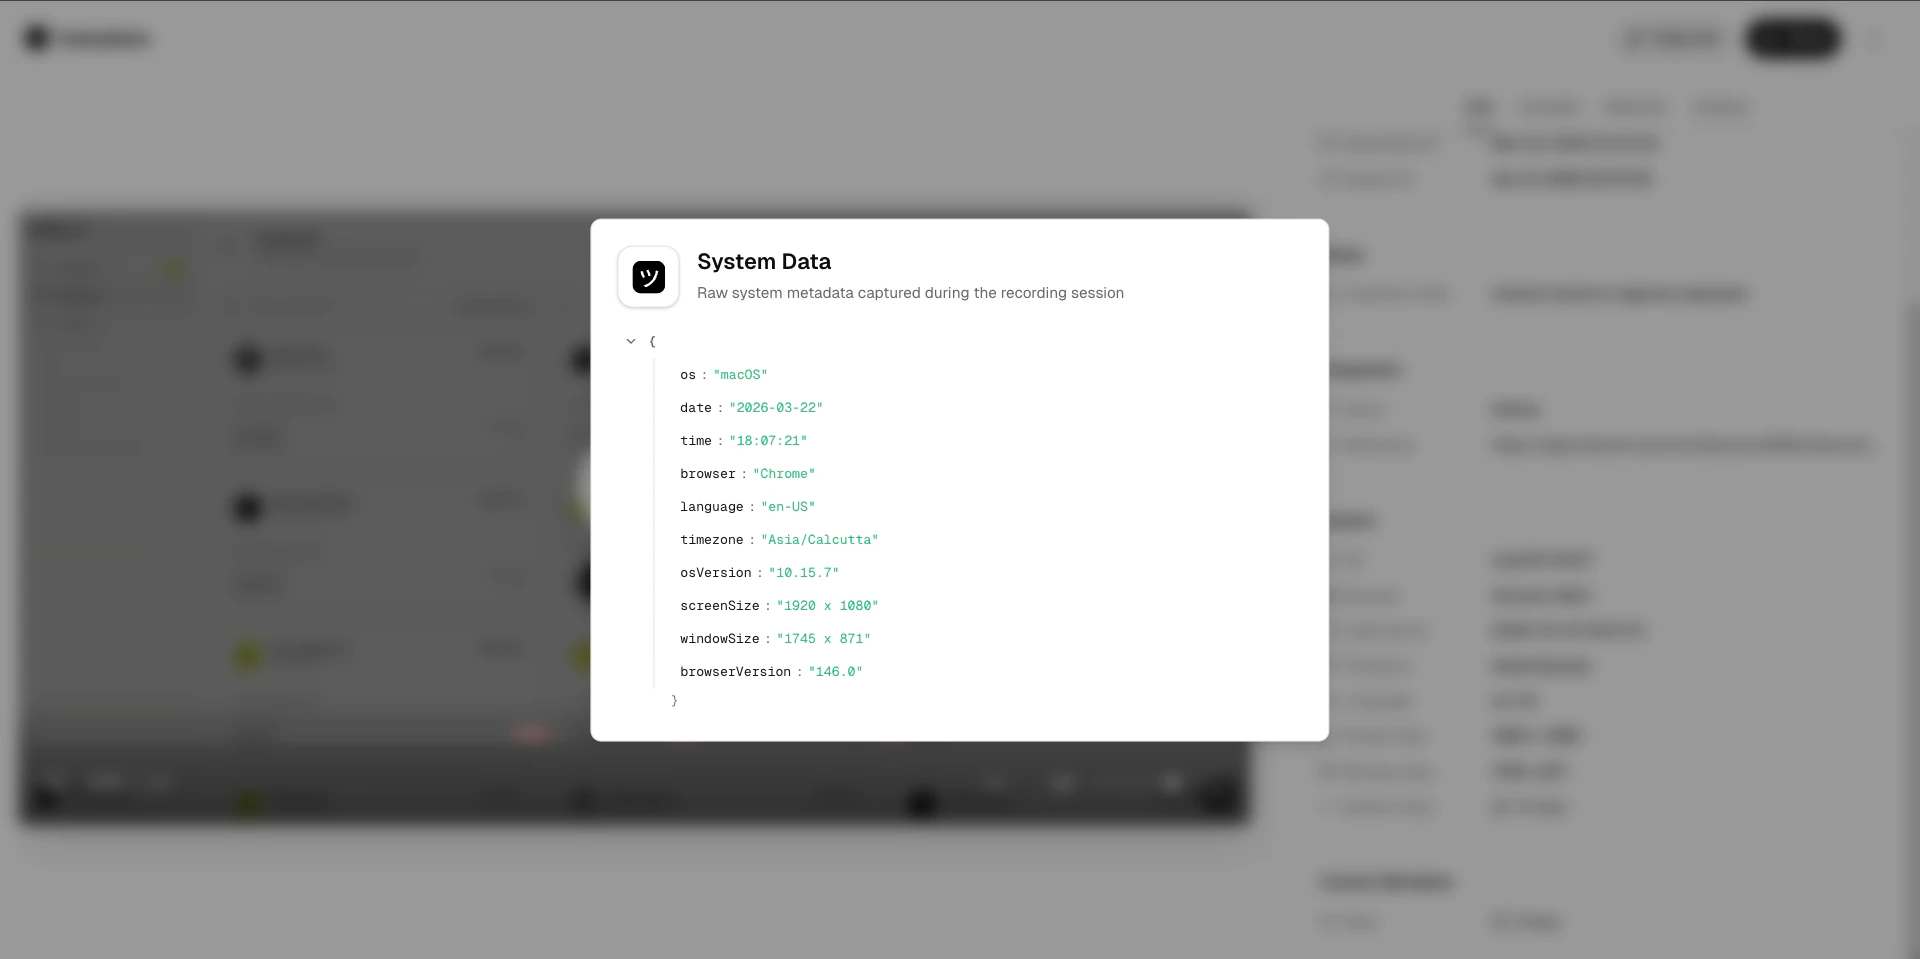
    View recording metadata — system information, custom metadata, and session details.

    <Frame caption="Info panel">
      <img src="https://mintcdn.com/userplane/iHJrxtyvOmNXmfMS/media/playback/info/info-panel-metadata-collapsed.png?fit=max&auto=format&n=iHJrxtyvOmNXmfMS&q=85&s=88b4acd4c7d76acd9aa98be25c01527a" width="1920" height="956" data-path="media/playback/info/info-panel-metadata-collapsed.png" />
    </Frame>

    <Frame caption="Metadata expanded">
      <img src="https://mintcdn.com/userplane/iHJrxtyvOmNXmfMS/media/playback/info/info-panel-metadata-expanded.png?fit=max&auto=format&n=iHJrxtyvOmNXmfMS&q=85&s=1d57c8854705159e8023274ccc03c7f1" width="1920" height="958" data-path="media/playback/info/info-panel-metadata-expanded.png" />
    </Frame>

    <Frame caption="System information">
      <img src="https://mintcdn.com/userplane/iHJrxtyvOmNXmfMS/media/playback/info/info-panel-system-expanded.png?fit=max&auto=format&n=iHJrxtyvOmNXmfMS&q=85&s=3b8806e48f288fb578164f3dd08709e7" width="1920" height="959" data-path="media/playback/info/info-panel-system-expanded.png" />
    </Frame>
  </Tab>
</Tabs>

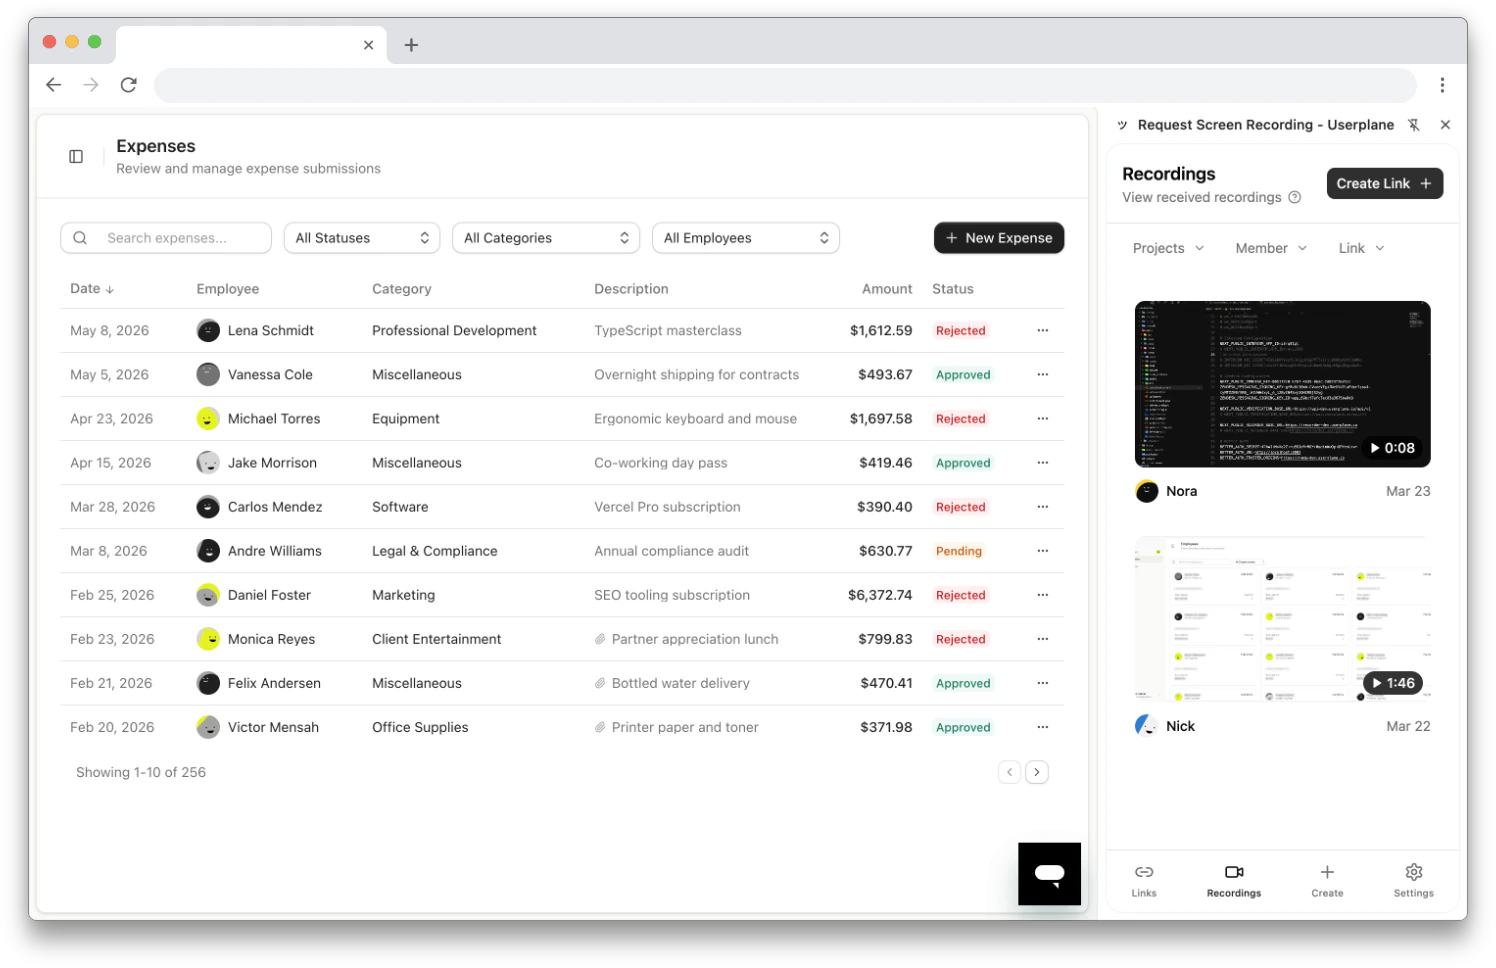
## Quick access from the Chrome extension

You can also browse recordings from the [Chrome extension](/integrations/chrome-extension-recordings) side panel without opening the dashboard. The Recordings tab shows thumbnails, durations, and expiry warnings — click any recording to open it in the full dashboard playback view.

This is useful for a quick check on incoming recordings while you're working in another tab. See [Chrome Extension Recordings](/integrations/chrome-extension-recordings) for details.

<Frame caption="Recordings in the Chrome extension side panel">
  <img src="https://mintcdn.com/userplane/8_FOZno9A0XwGdNH/media/extension/extension-list-recordings.png?fit=max&auto=format&n=8_FOZno9A0XwGdNH&q=85&s=9807ddc20dd405d4301538b41406f8f2" width="1496" height="968" data-path="media/extension/extension-list-recordings.png" />
</Frame>
