Console log viewer
Triggered by:userplane_show_rec_console
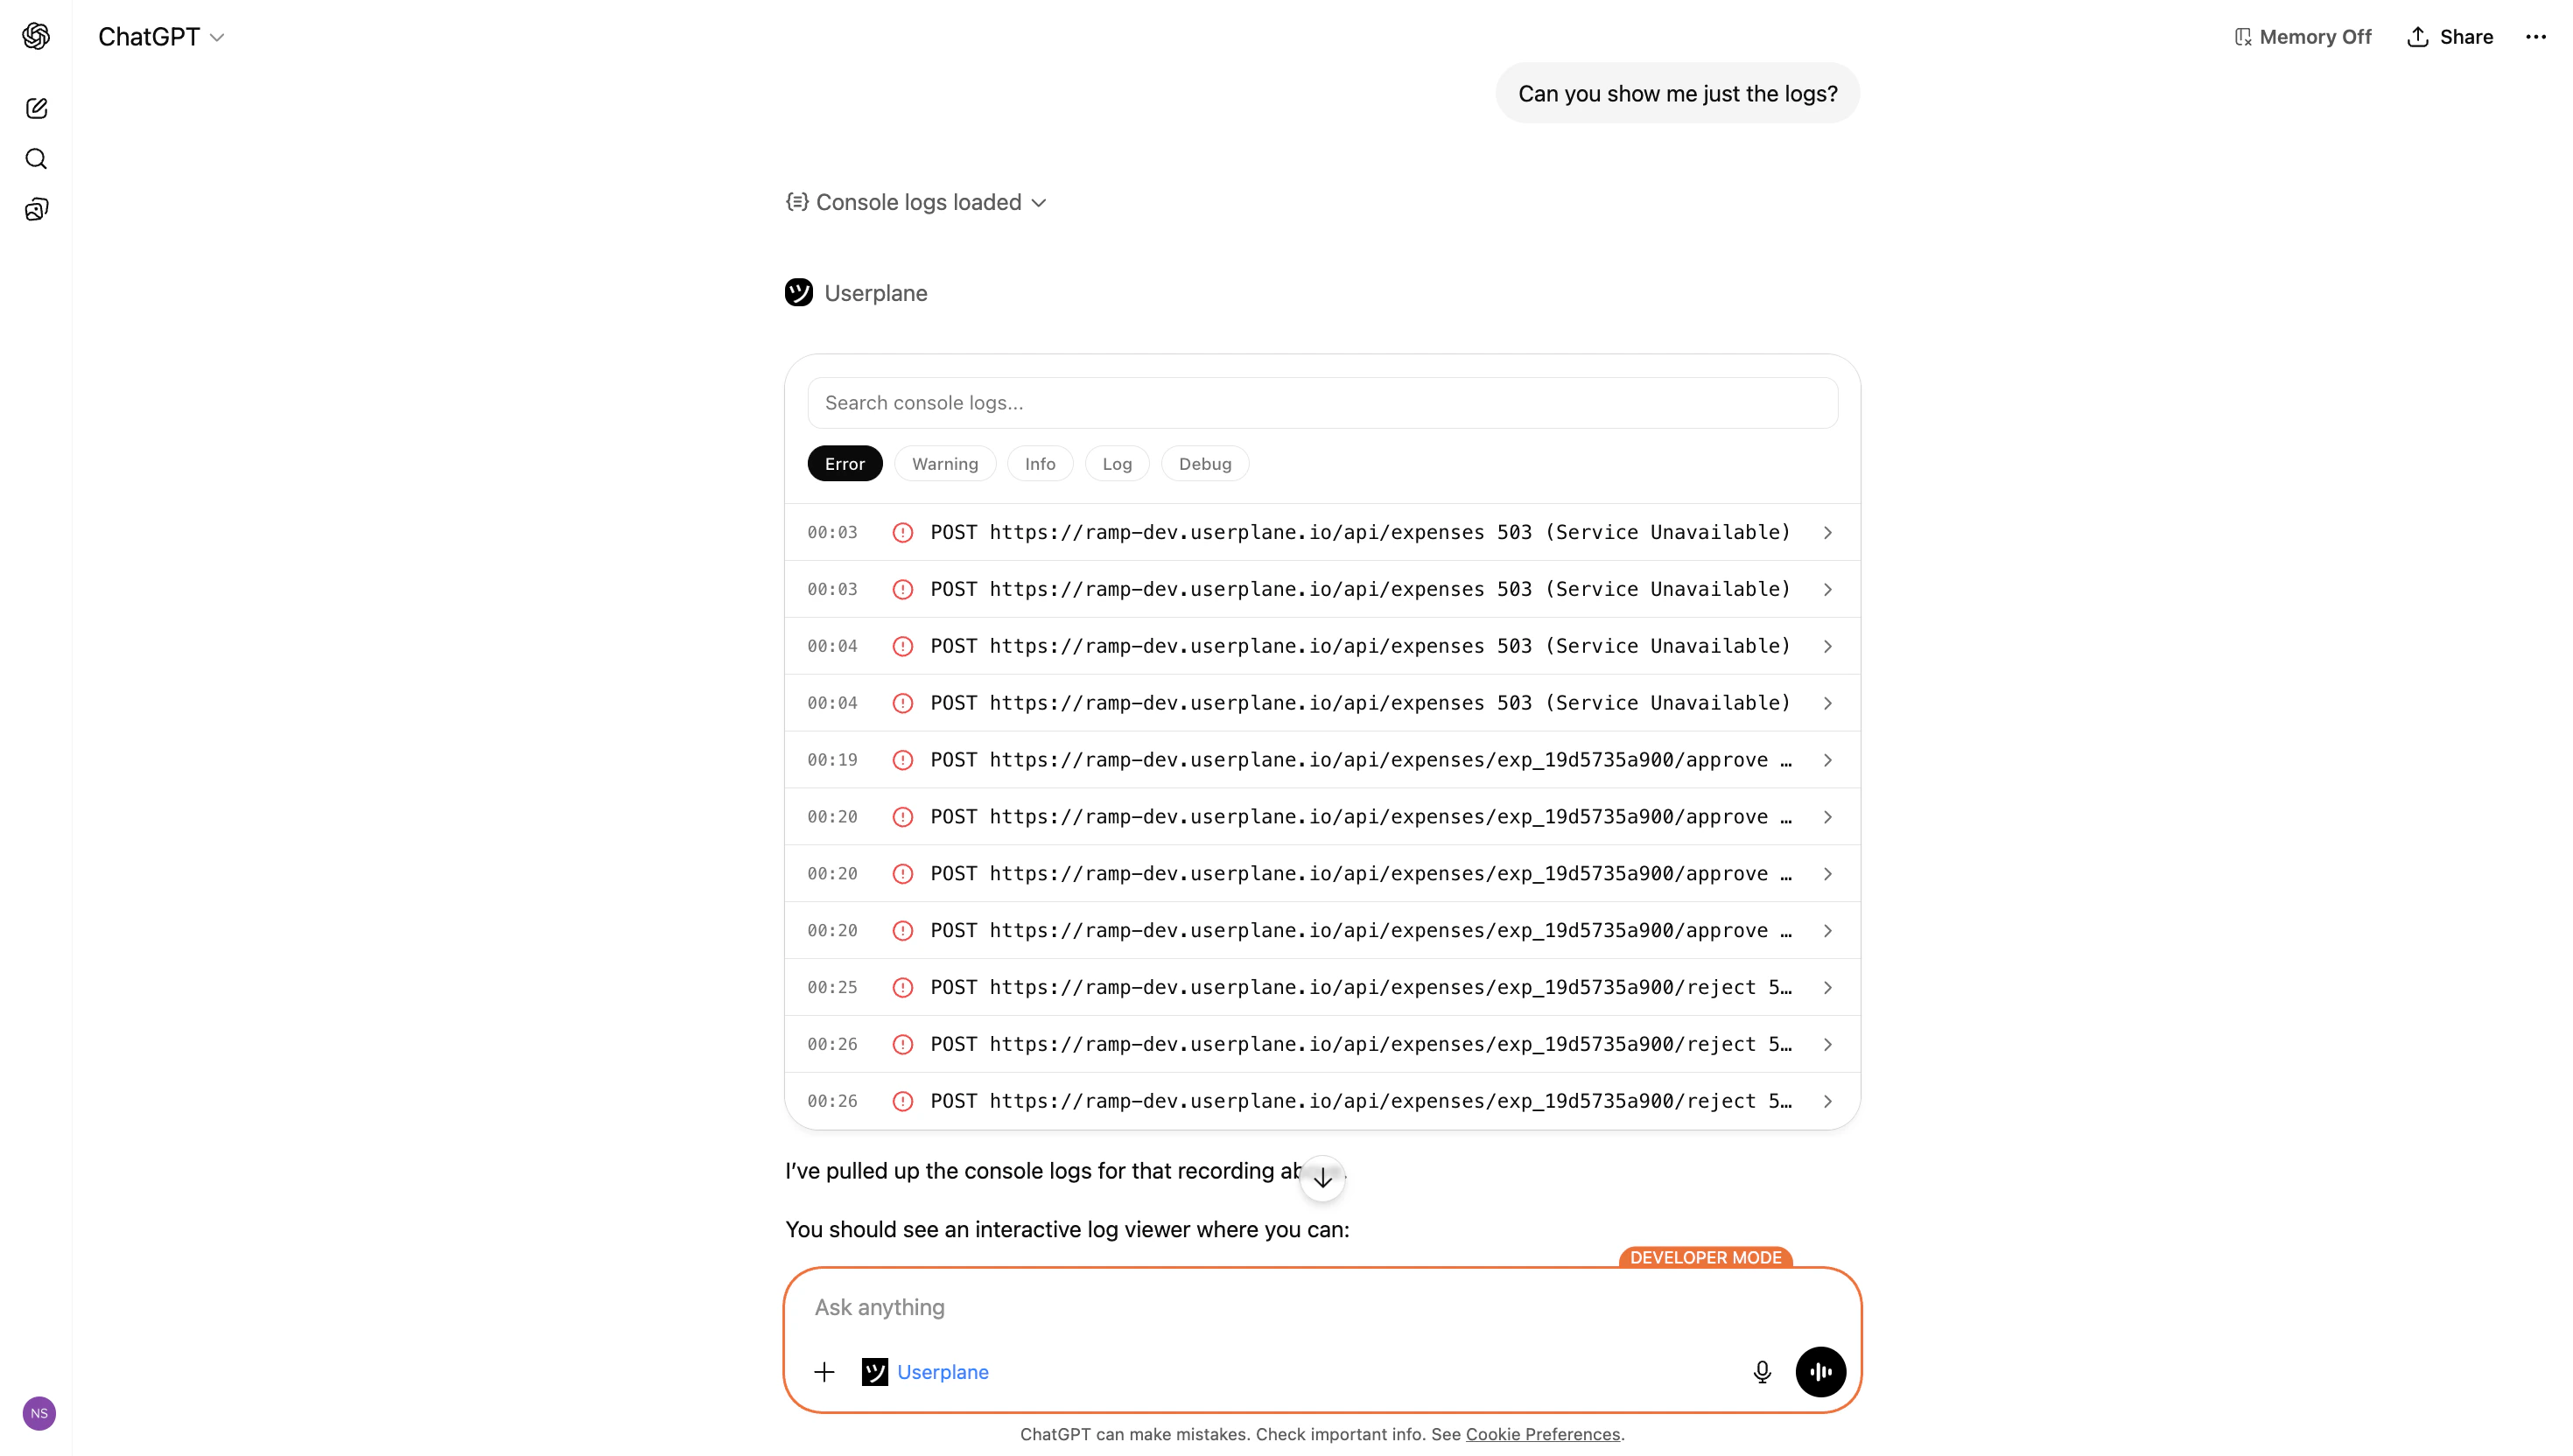
Displays browser console log entries captured during the recording.
- Claude
- ChatGPT
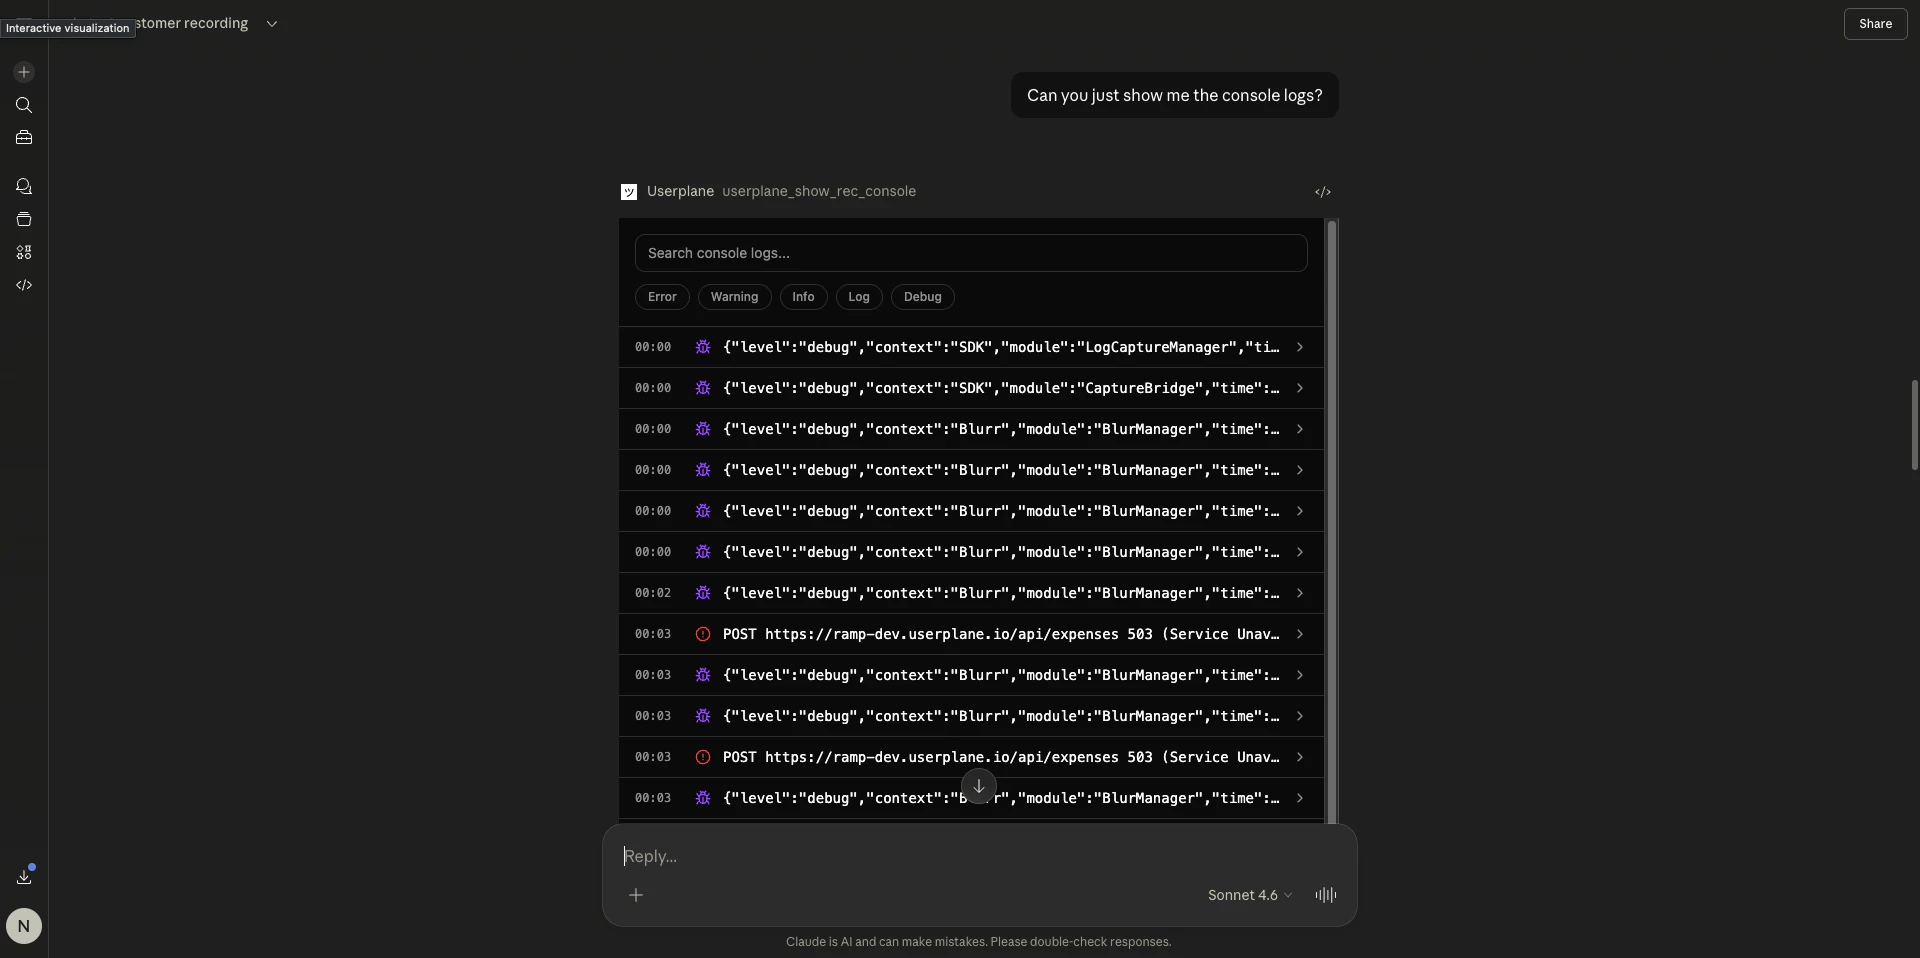
Console log viewer in Claude
- Level filtering — toggle visibility by level: error, warning, info, log, debug
- Search — full-text search across all log messages
- Timestamps — time relative to recording start
- Expandable entries — click to reveal stack traces, source URLs, and detailed output
- Color coding — entries styled by severity (red for errors, yellow for warnings)
Example prompts
Network request viewer
Triggered by:userplane_show_rec_network
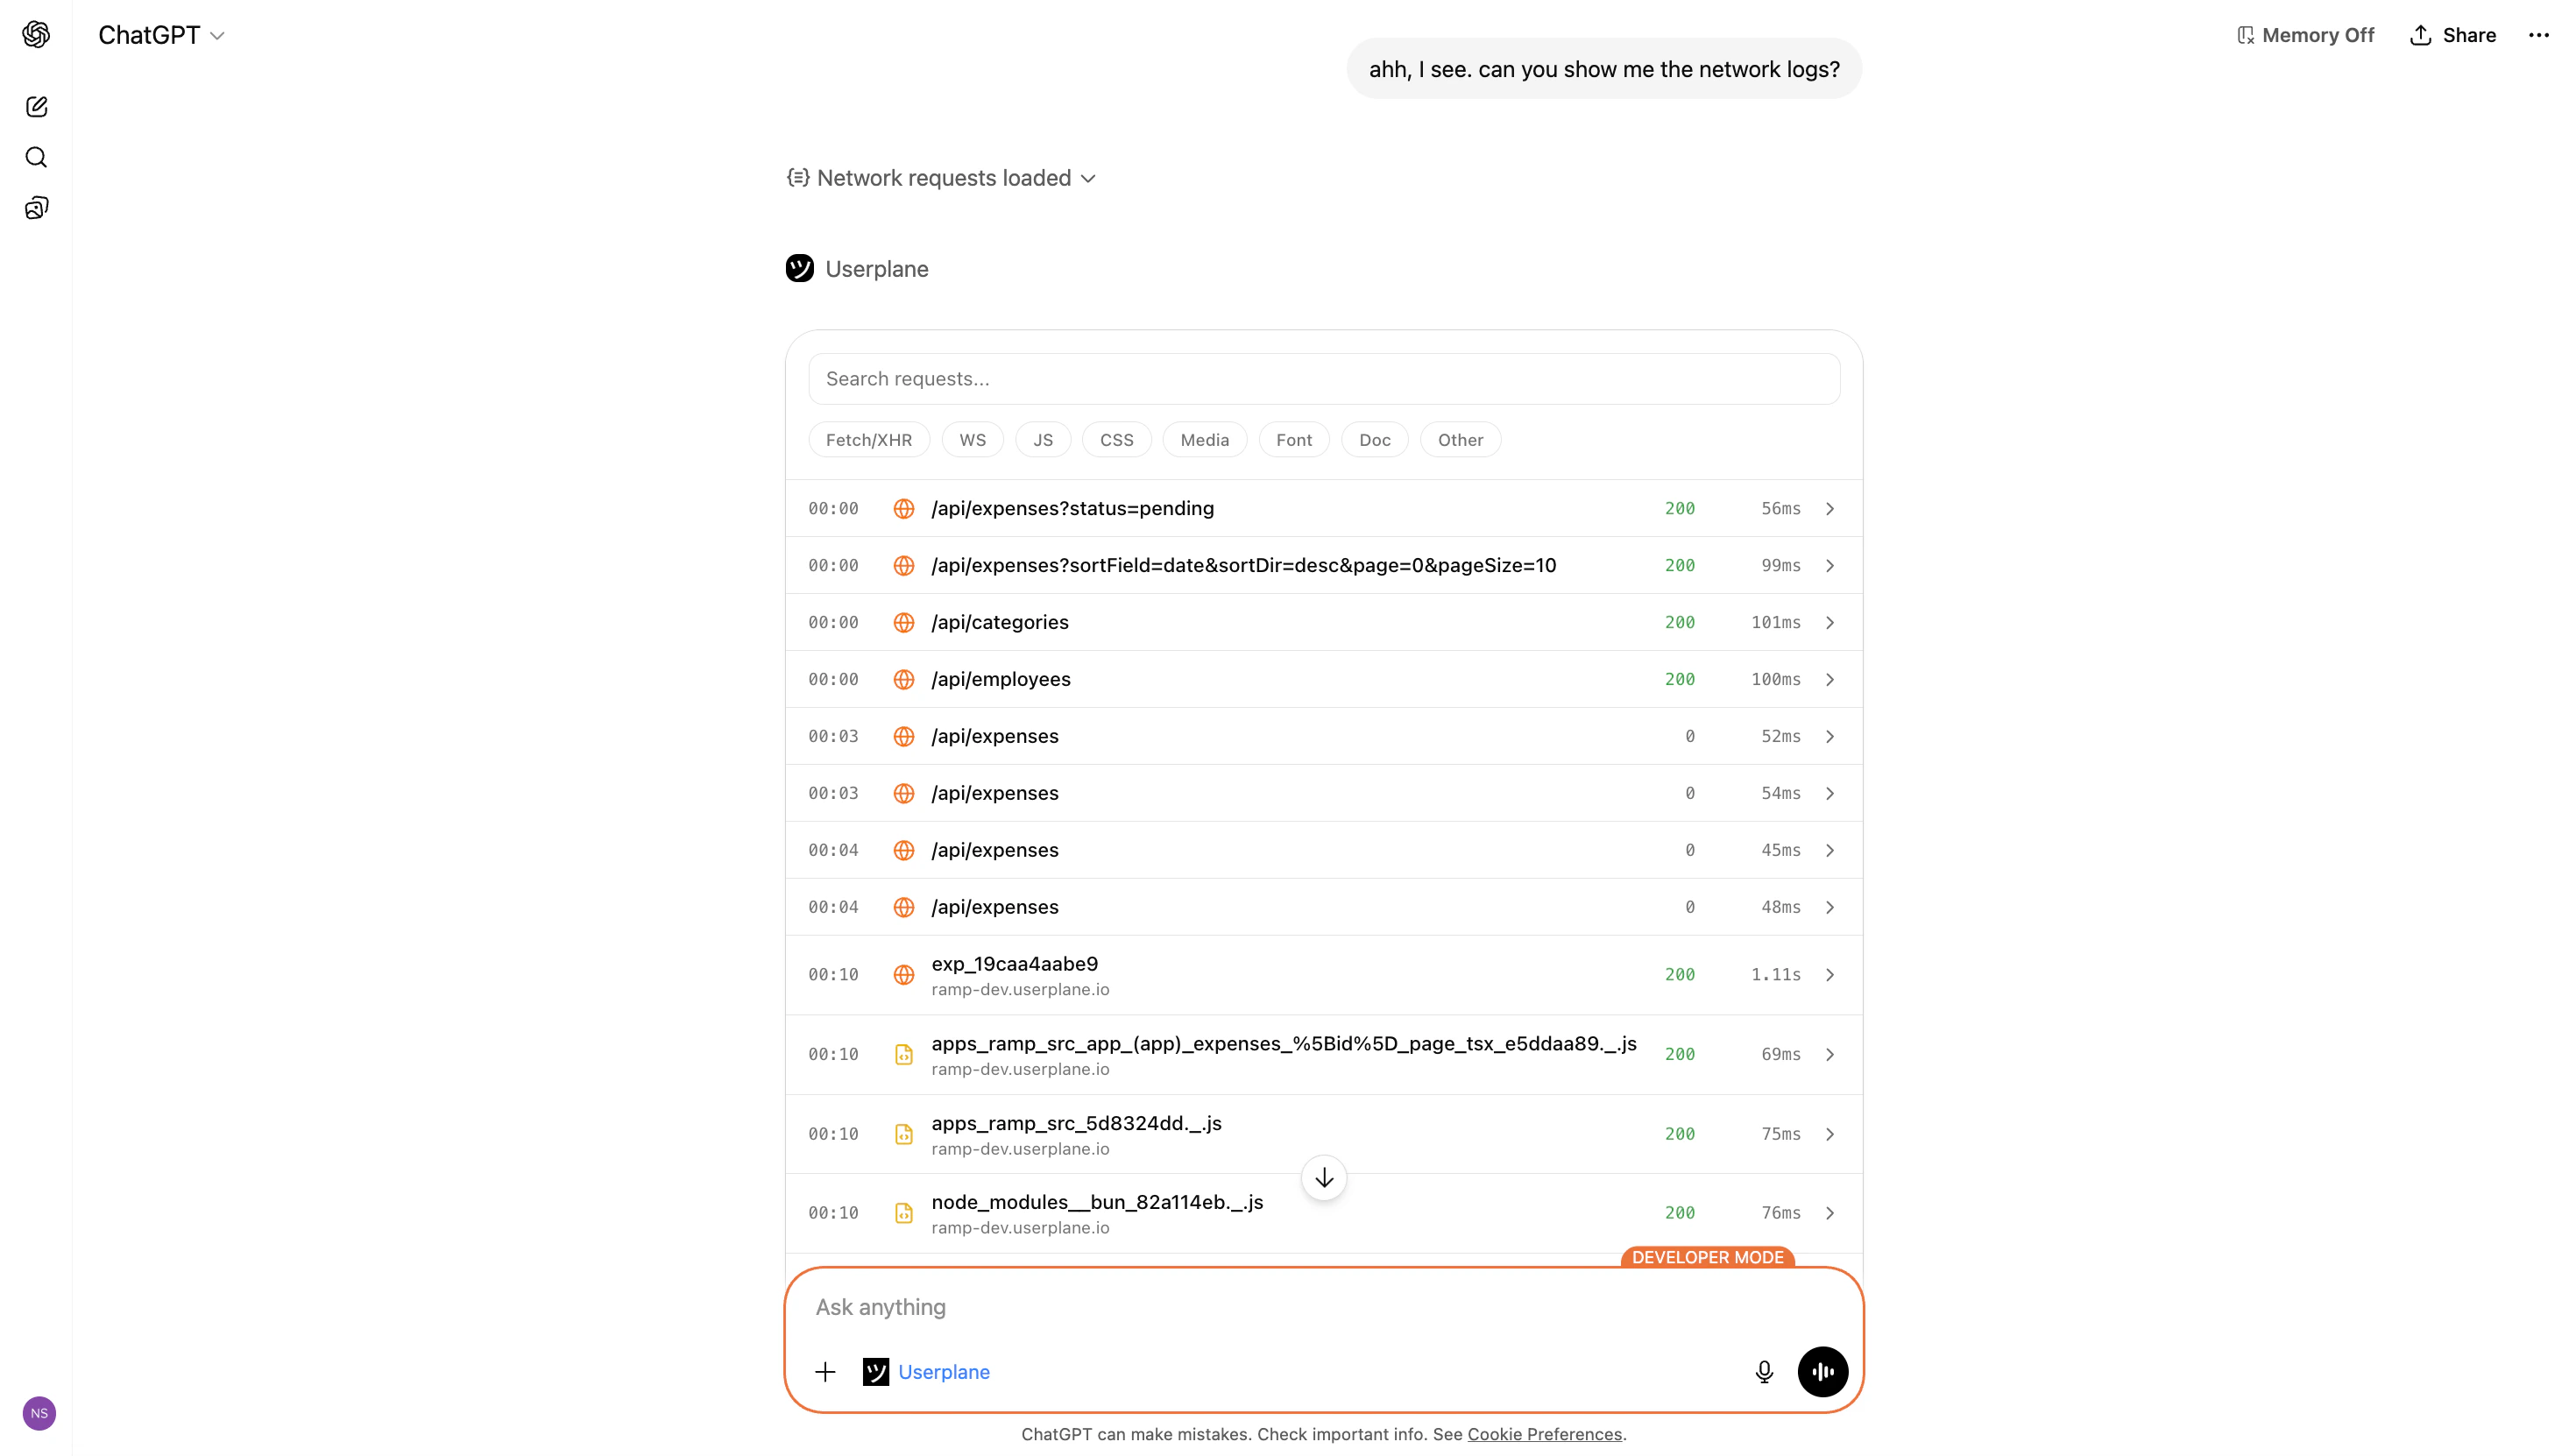
Displays HTTP request and response entries captured during the recording.
- Claude
- ChatGPT
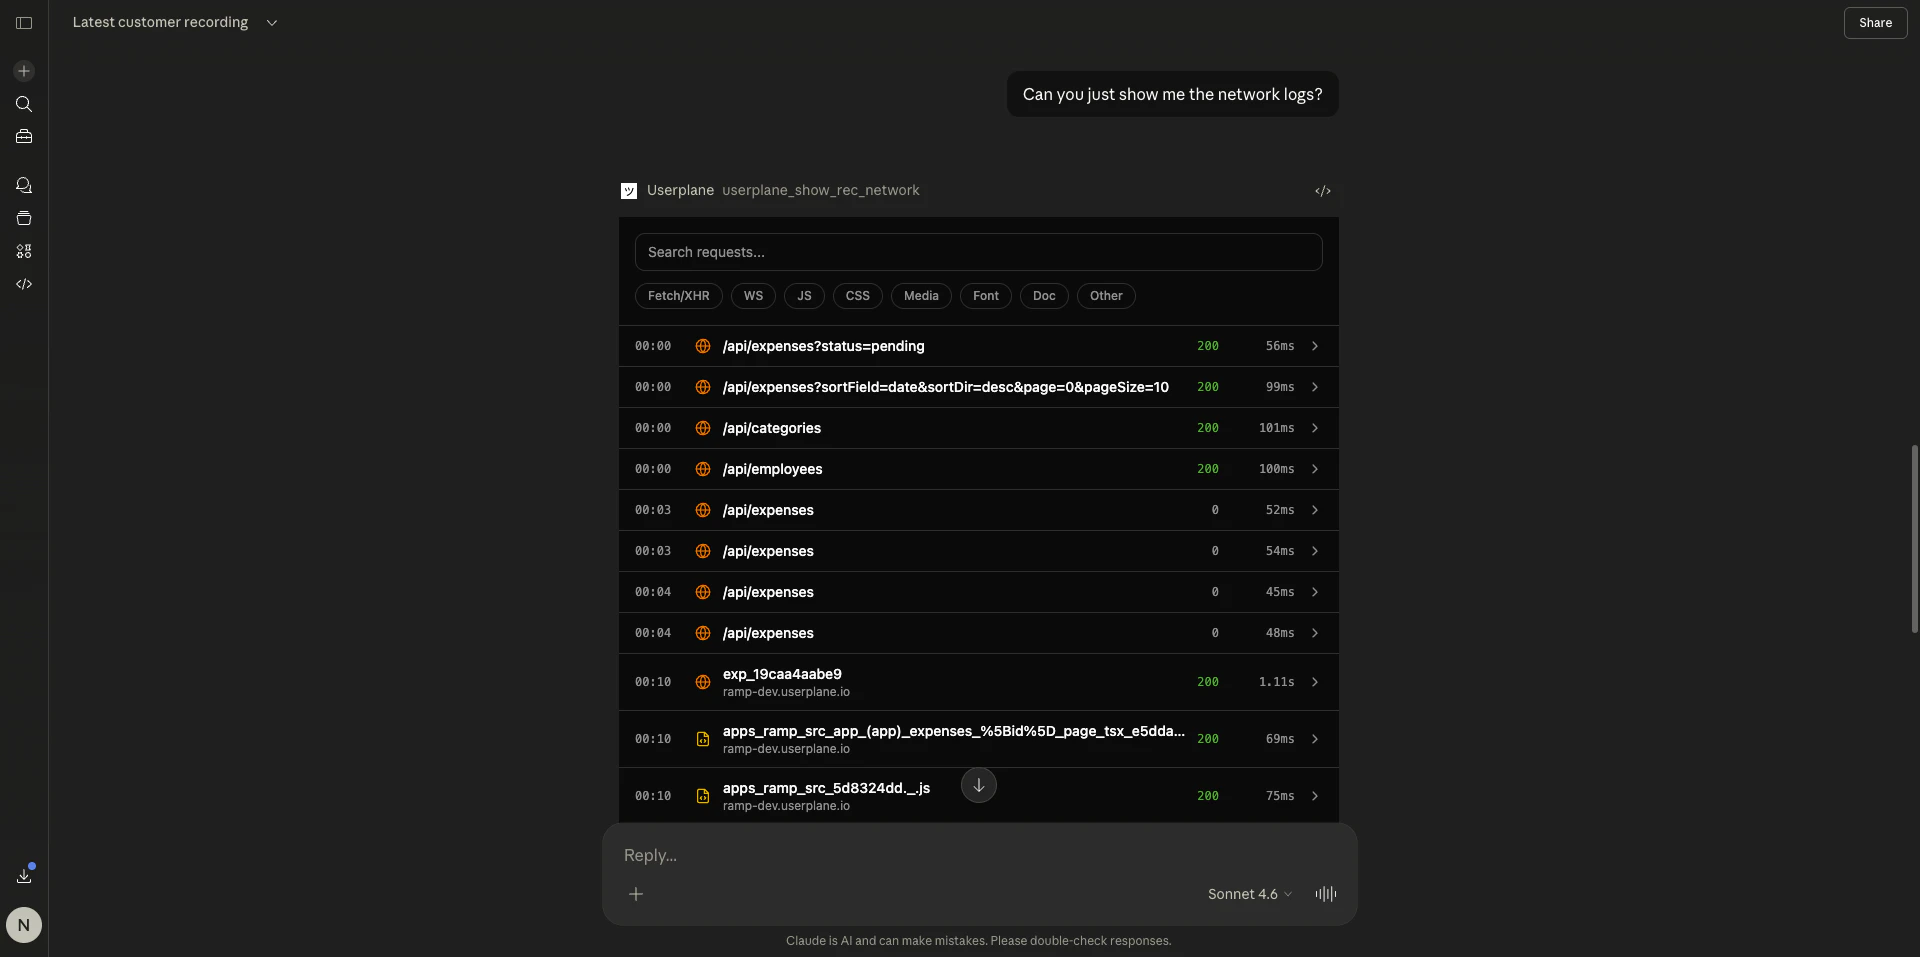
Network request viewer in Claude
- Status codes — color-coded by response class (2xx, 3xx, 4xx, 5xx)
- Durations — request timing in milliseconds
- Type filtering — filter by request type (XHR, fetch, document, stylesheet, script, image)
- Search — search by URL, method, or status code
- Expandable entries — click to reveal:
- Request and response headers
- Request and response bodies
- JSON payloads formatted for readability
- MIME type and content length
Example prompts
User action viewer
Triggered by:userplane_show_rec_actions
Displays user interaction events captured during the recording.
- Claude
- ChatGPT
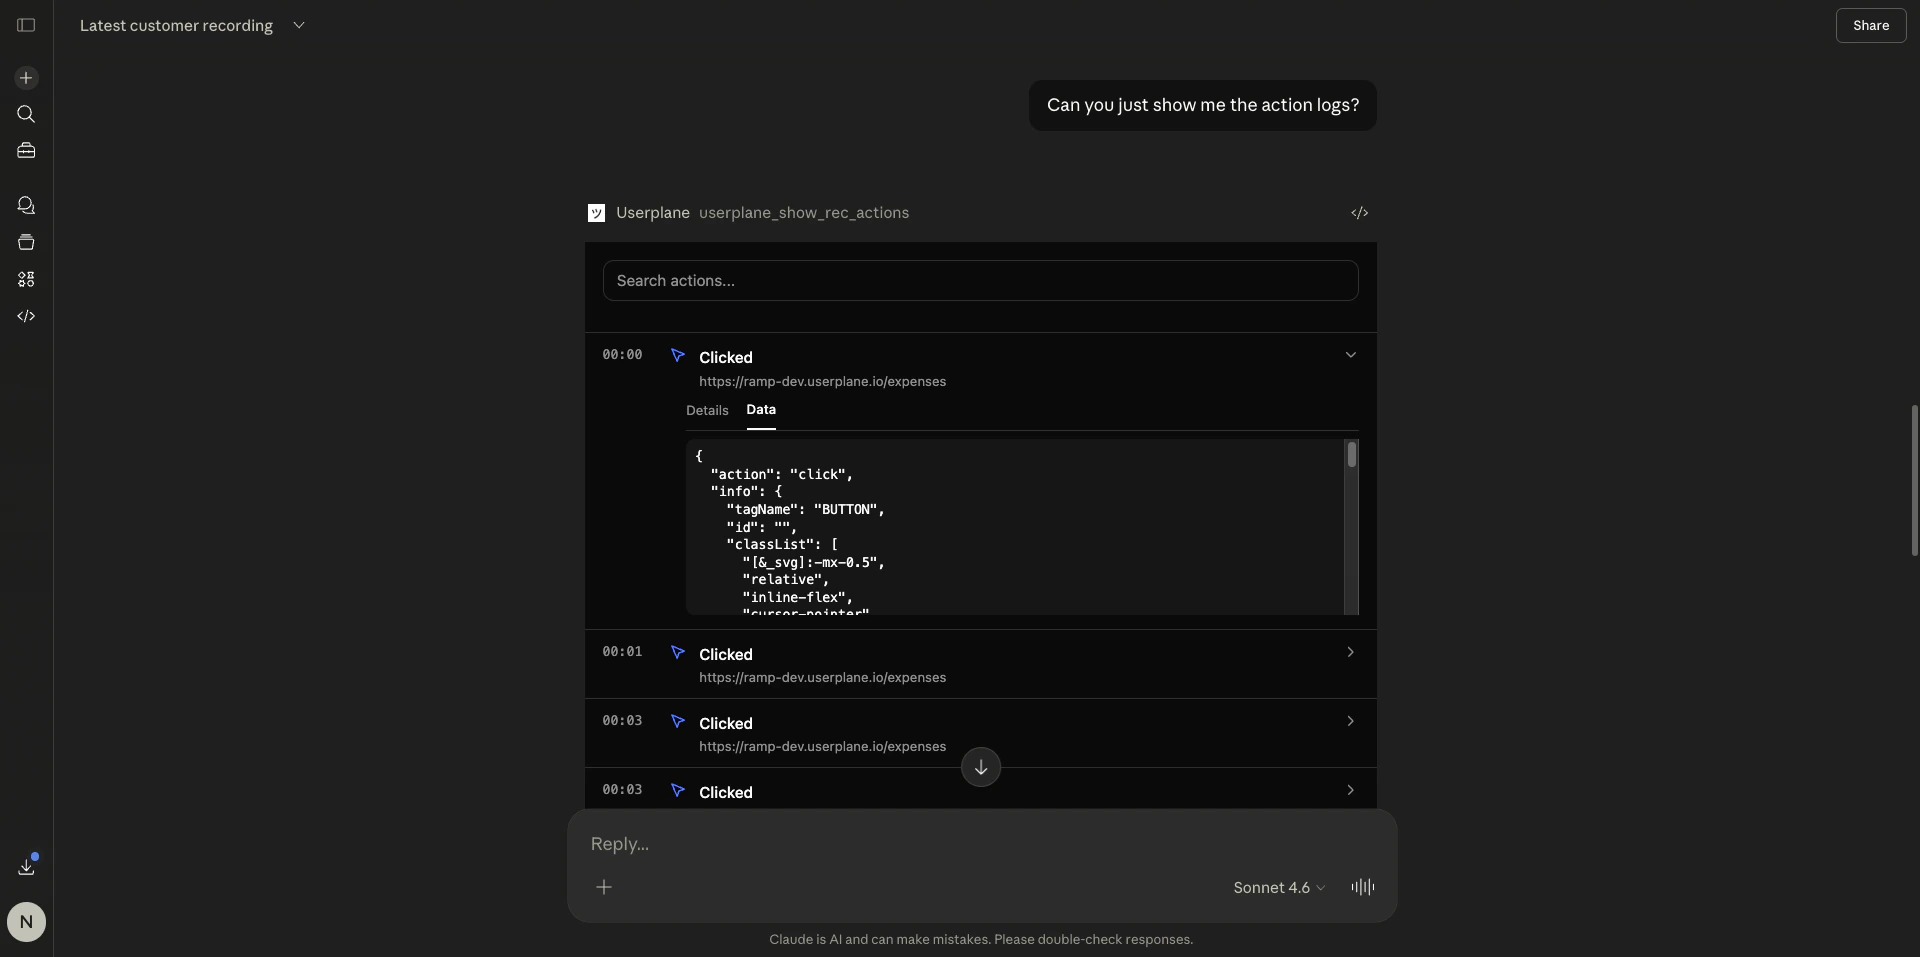
User action viewer in Claude
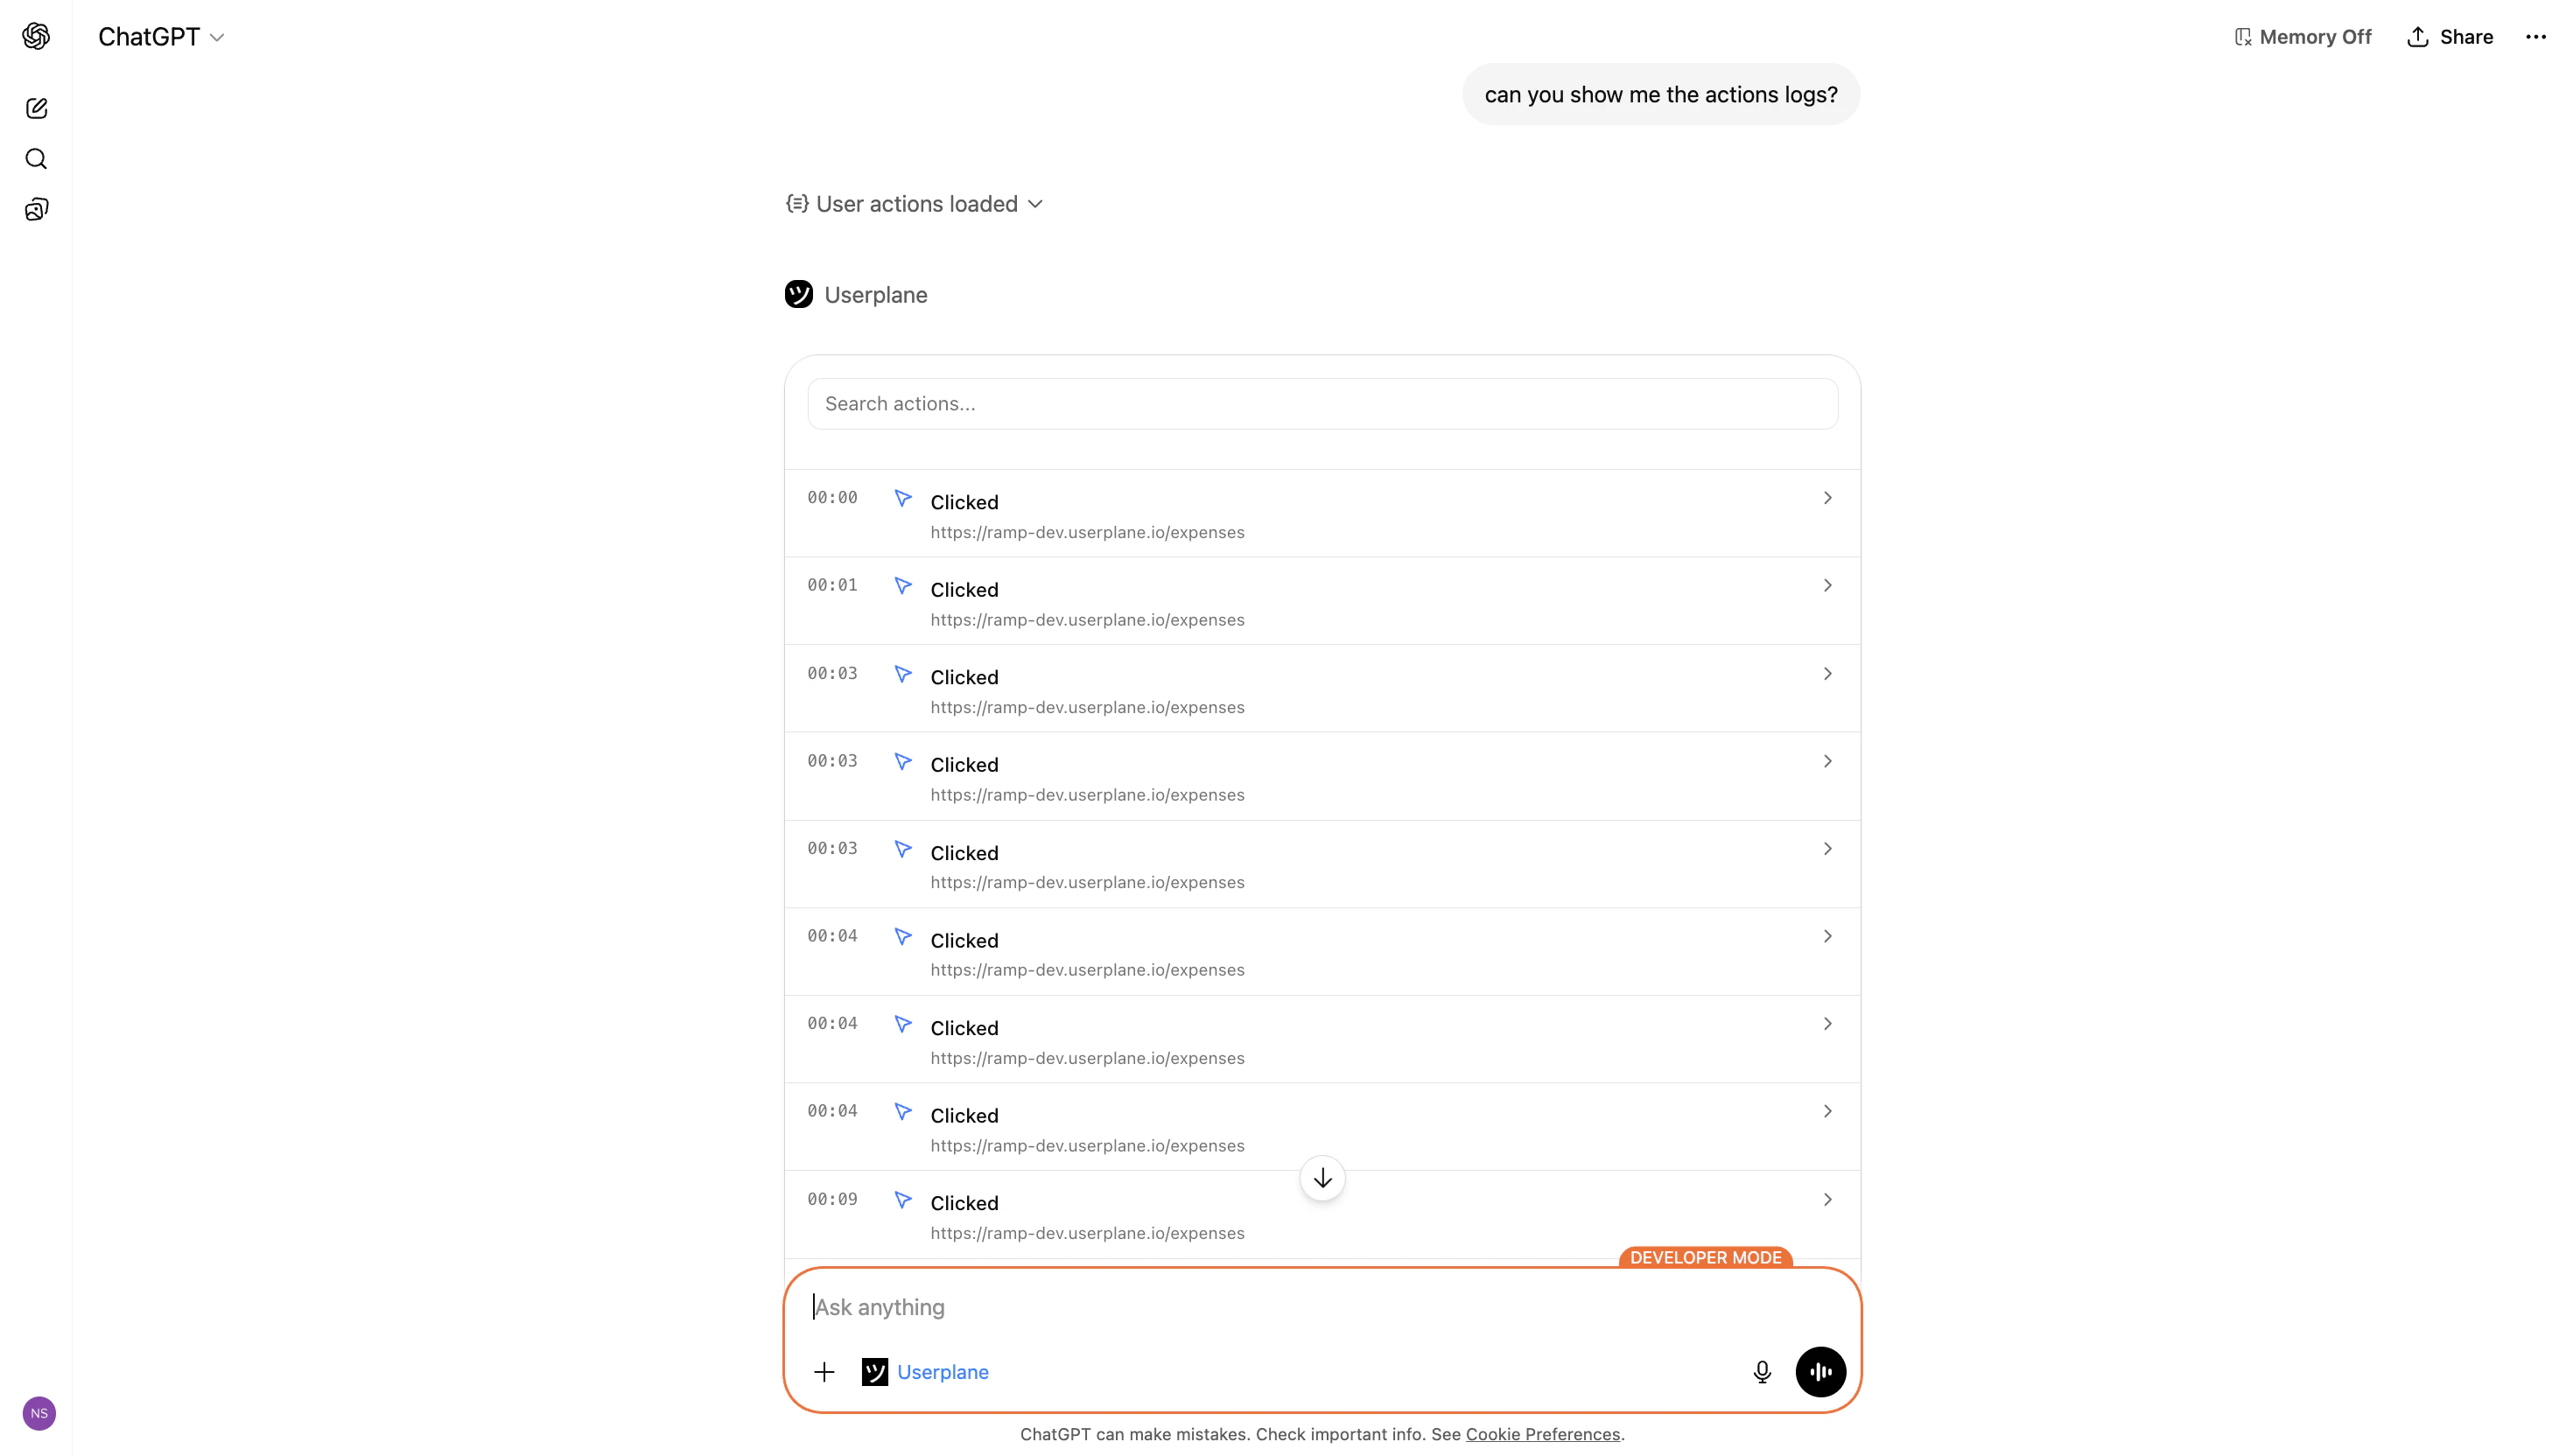
- Action types — clicks, page navigation, tab switches, page lifecycle events (load, unload, visibility change)
- Type filtering — filter by action category
- Search — search across action details
- Timestamps — time relative to recording start
- Expandable entries — click to reveal:
- Element selectors (for click events)
- Source and destination URLs (for navigation)
- Event-specific data
Example prompts
When to use resource viewers vs. the recording viewer
Related articles
- Recording Viewer — full recording viewer with video, metadata, and all session data.
- Interactive Apps Overview — client support matrix and how MCP Apps work.
- Recording Tools — all recording-related MCP tools and parameters.