Opening Issue Analyzer
From the recording detail view, click the ⋮ (more options) menu in the top-right navigation bar and select Issue Analyzer. The modal loads the recording’s session data and generates a prompt.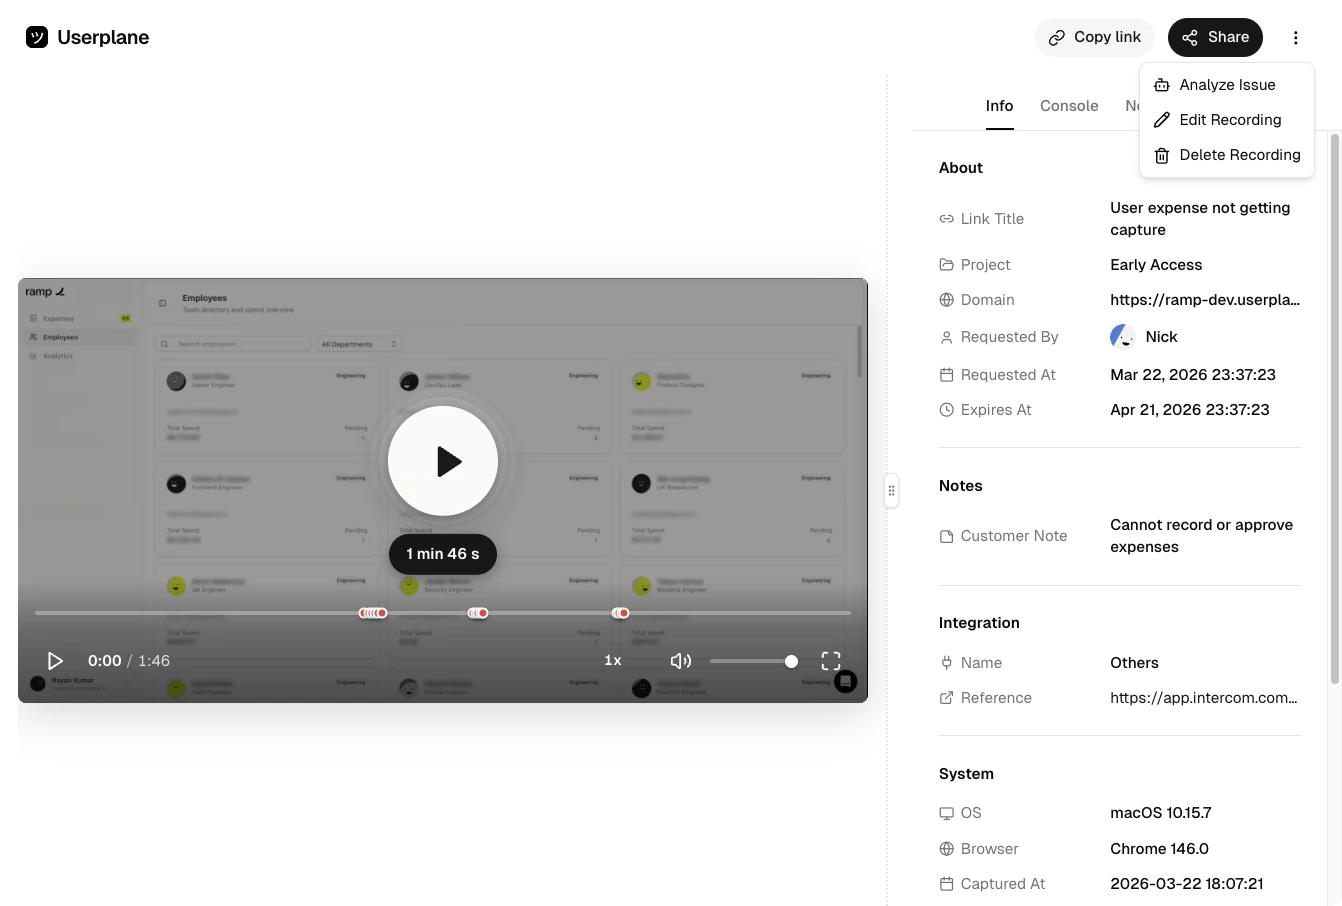
Recording options menu
Prompt modes
Two modes are available, selectable via tabs at the top of the modal:Explain
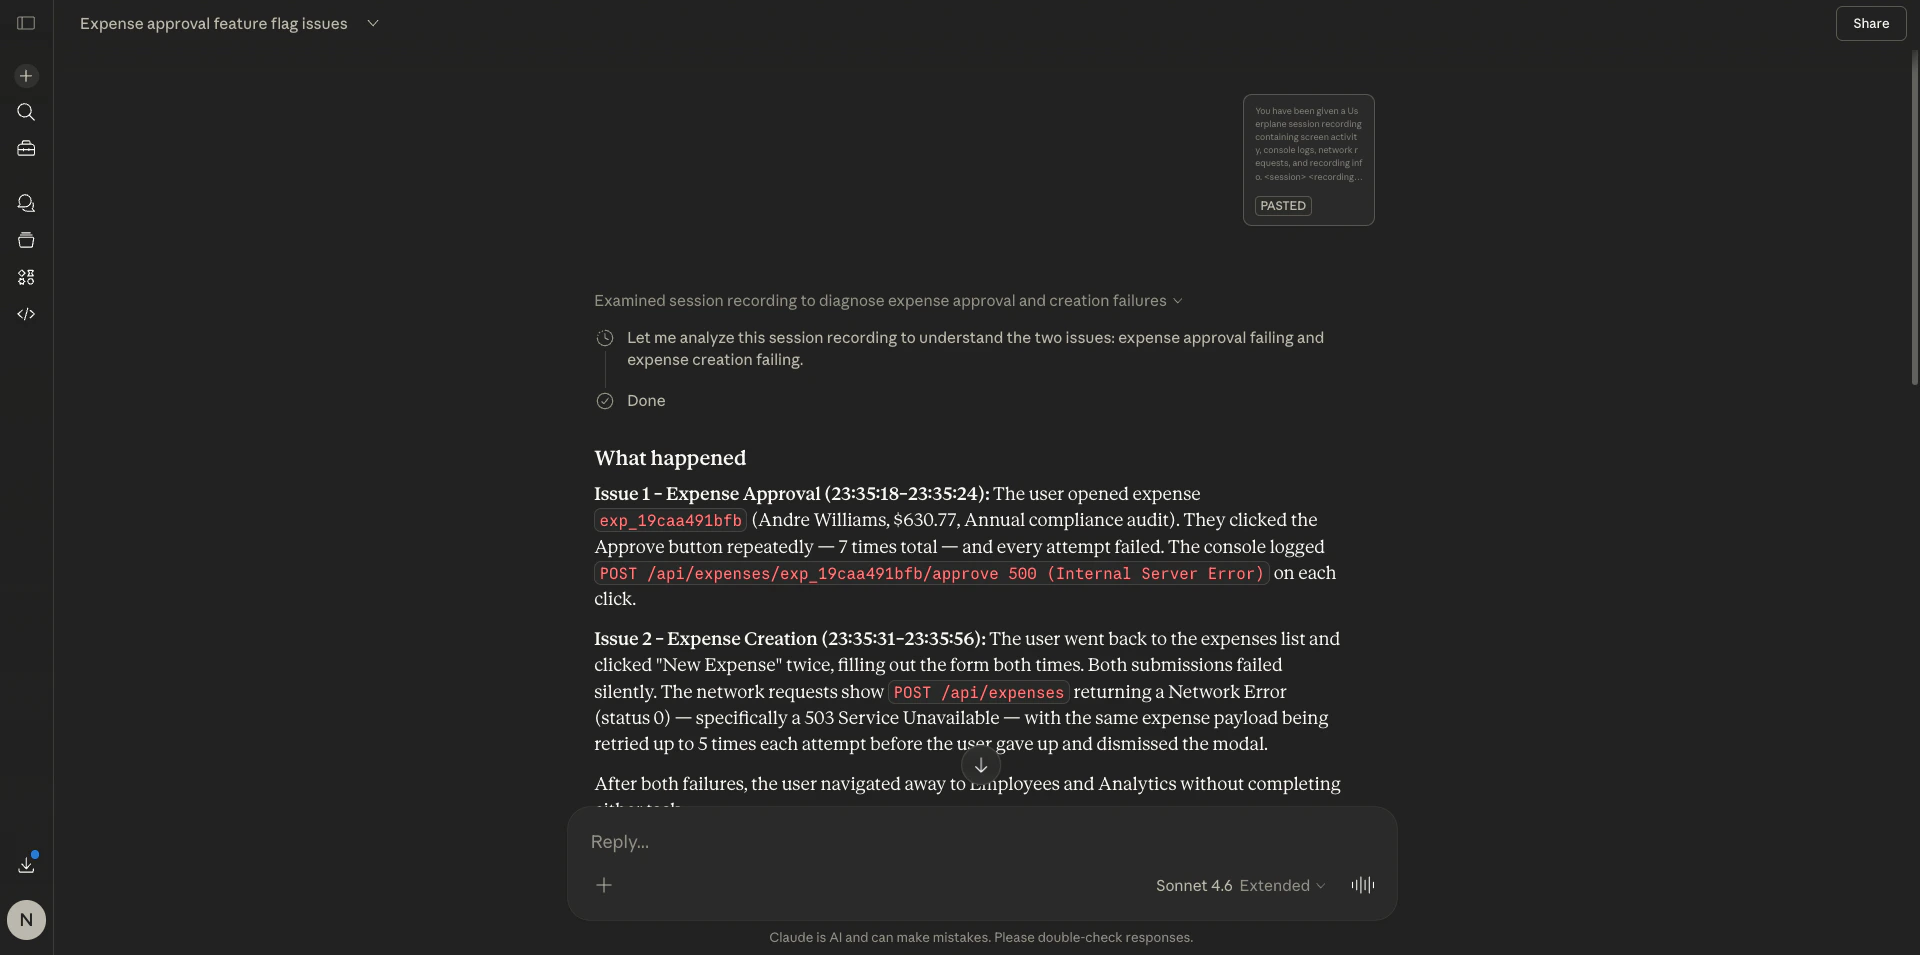
Designed for support agents and team members triaging a customer issue. The generated prompt asks the AI to walk through:- What happened — what the customer did, what the app tried to do, and where it broke down
- Why it happened — the technical root cause in plain language, suitable for pasting into a ticket or Slack message
- How to fix it — split by what the customer can do immediately vs. what the dev team needs to fix in code
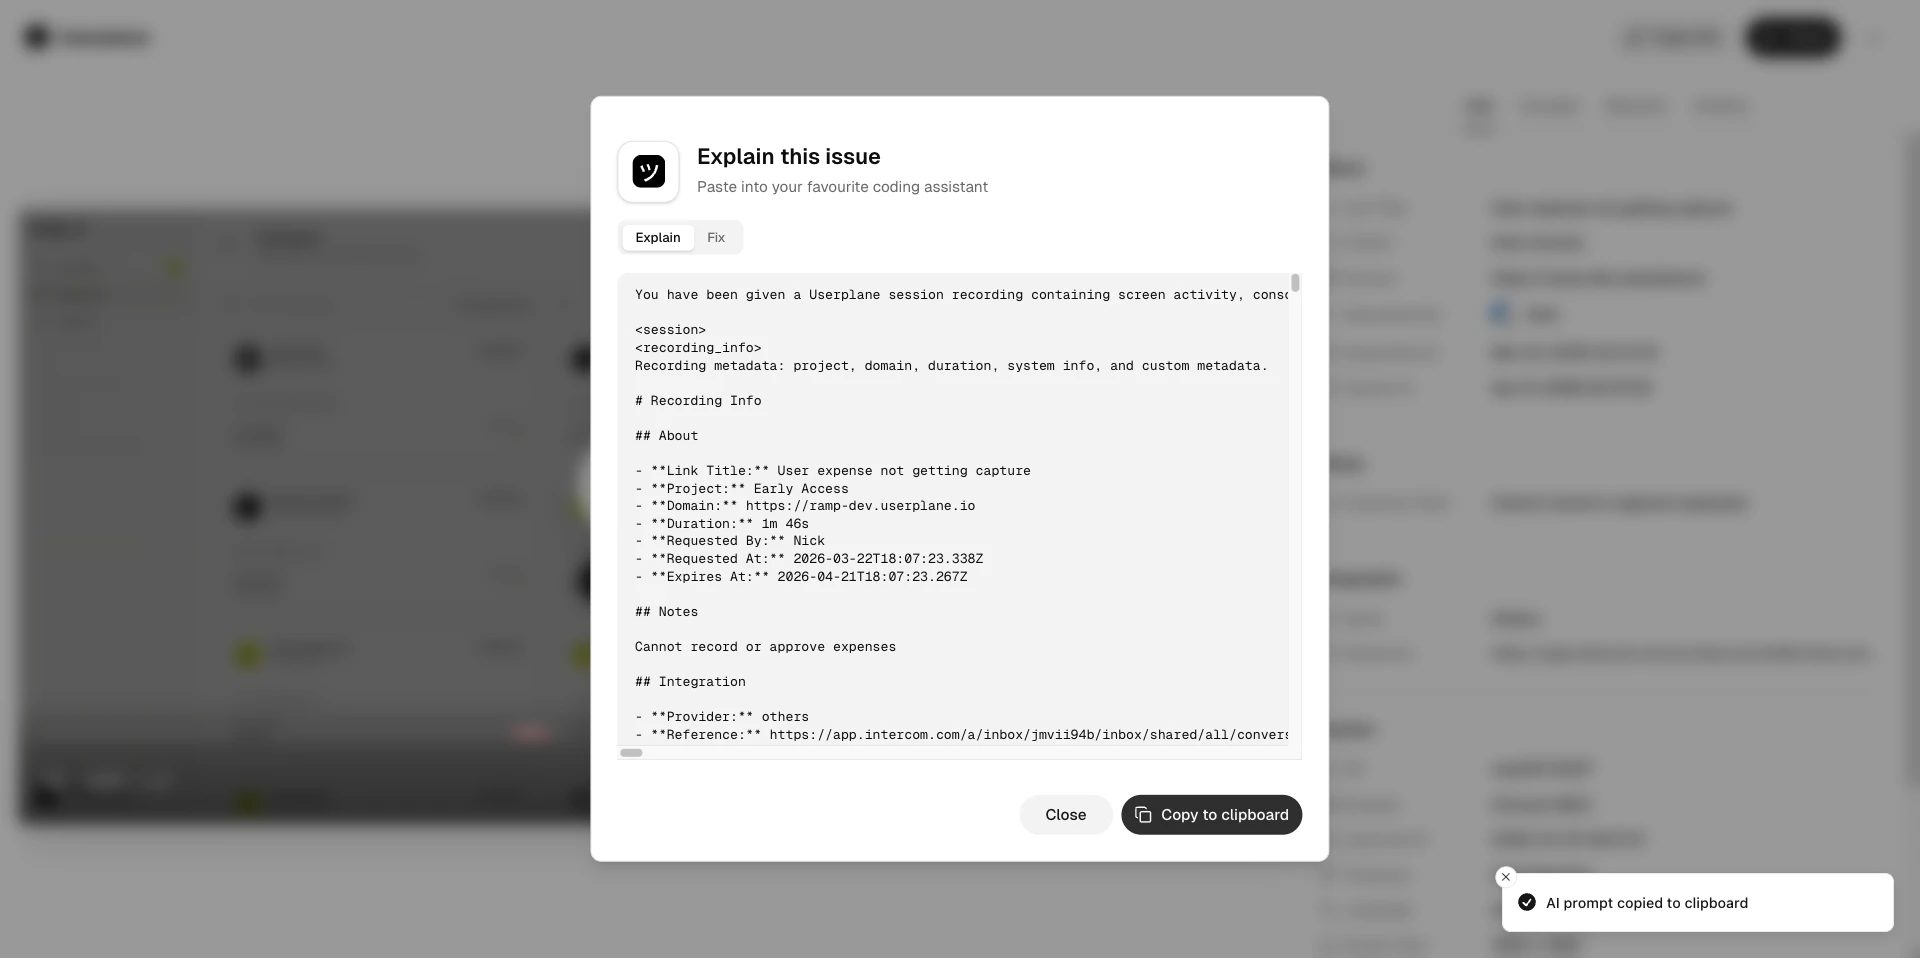
Issue Analyzer — Explain mode
Fix
Designed for engineers debugging a production issue. The prompt asks the AI to analyse:- Root cause — the exact failing request, error message, or console error with timestamp
- Affected code paths — the specific components, API endpoints, or services involved and what went wrong in each
- Fix — immediate mitigation steps, code changes required, and prevention measures
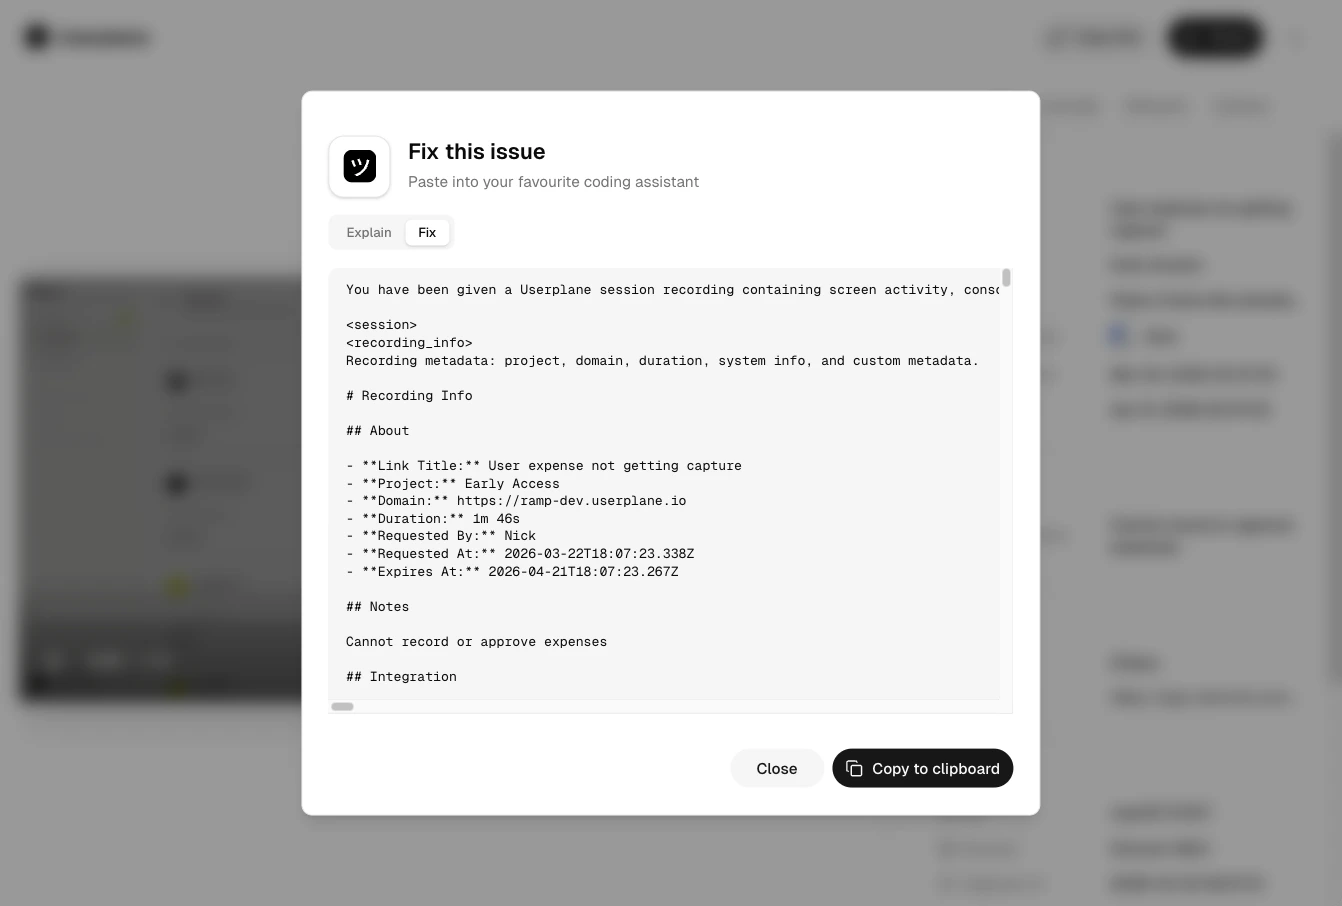
Issue Analyzer — Fix mode
Session data included
When you open Issue Analyzer, Userplane fetches the recording’s captured data and includes whichever of the following are available:If a data type wasn’t captured for the recording (based on your domain recording
preferences), it is omitted from the prompt.
Copying and using the prompt
Click Copy to clipboard to copy the full prompt, then paste it into your AI assistant of choice. The prompt is self-contained — no additional context is needed beyond what’s already included.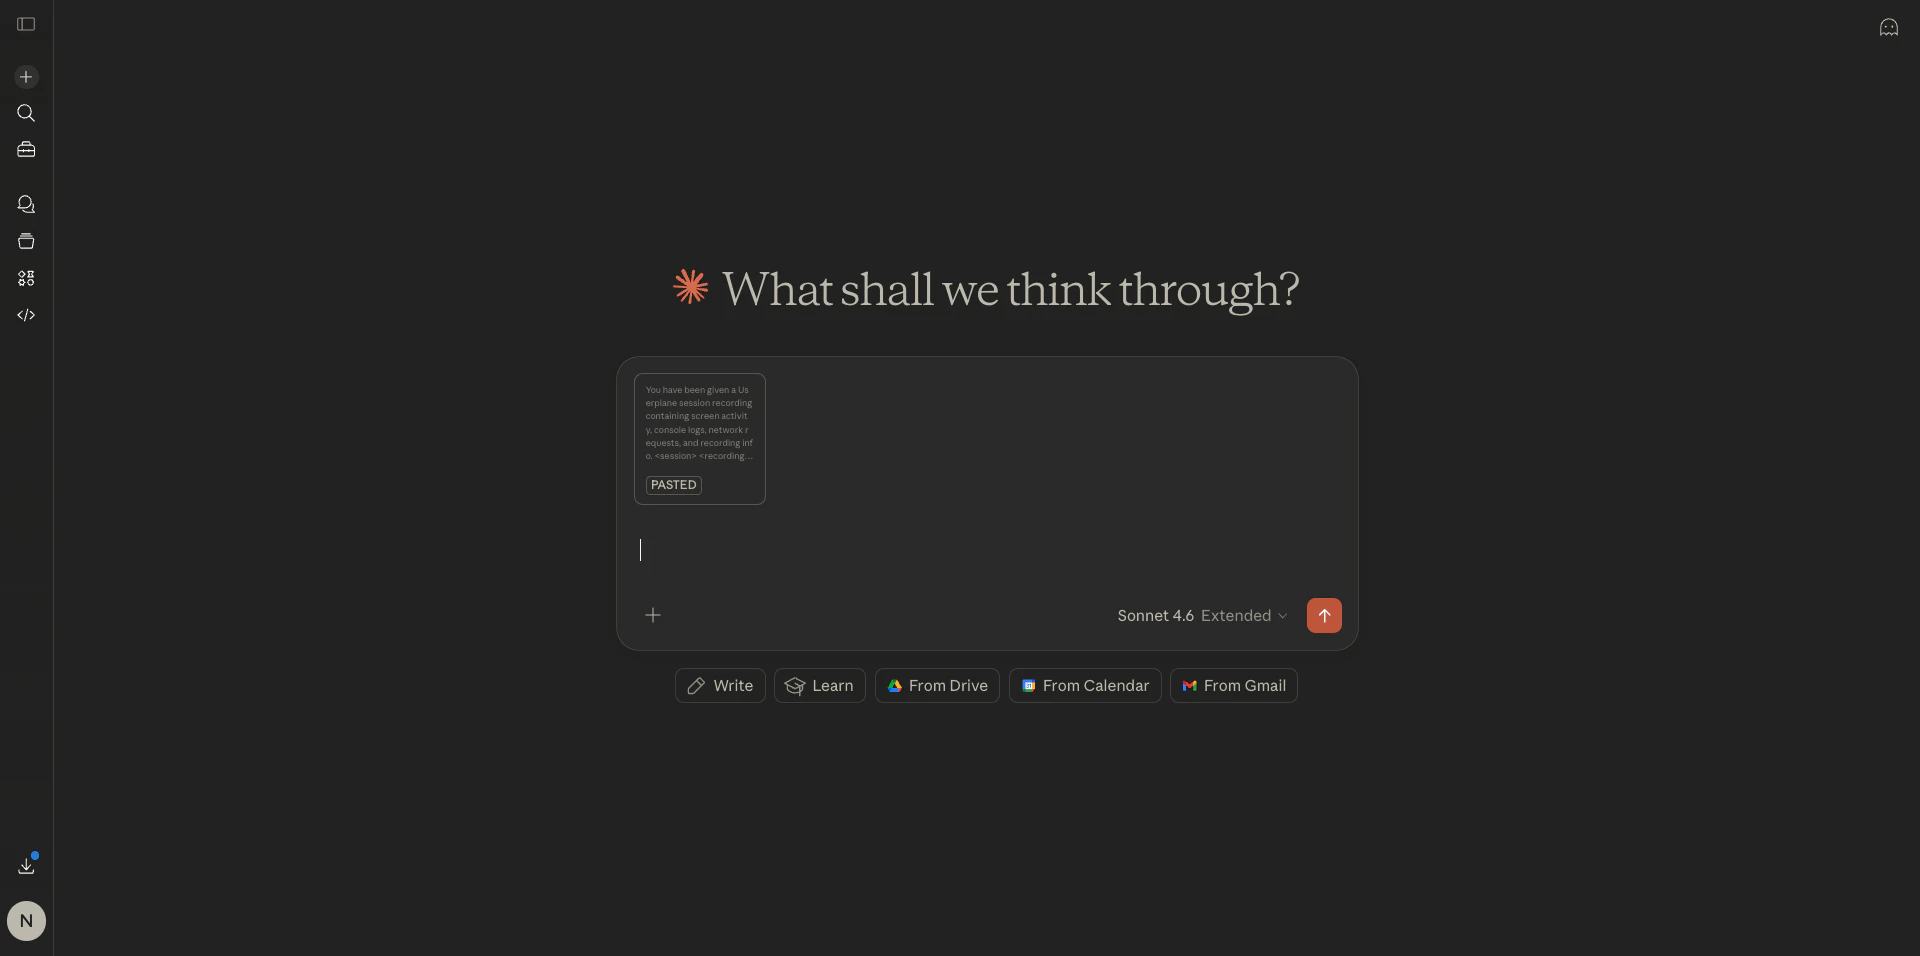
Using the generated prompt
AI response from the prompt