Watch recordings and inspect technical details in the detail view
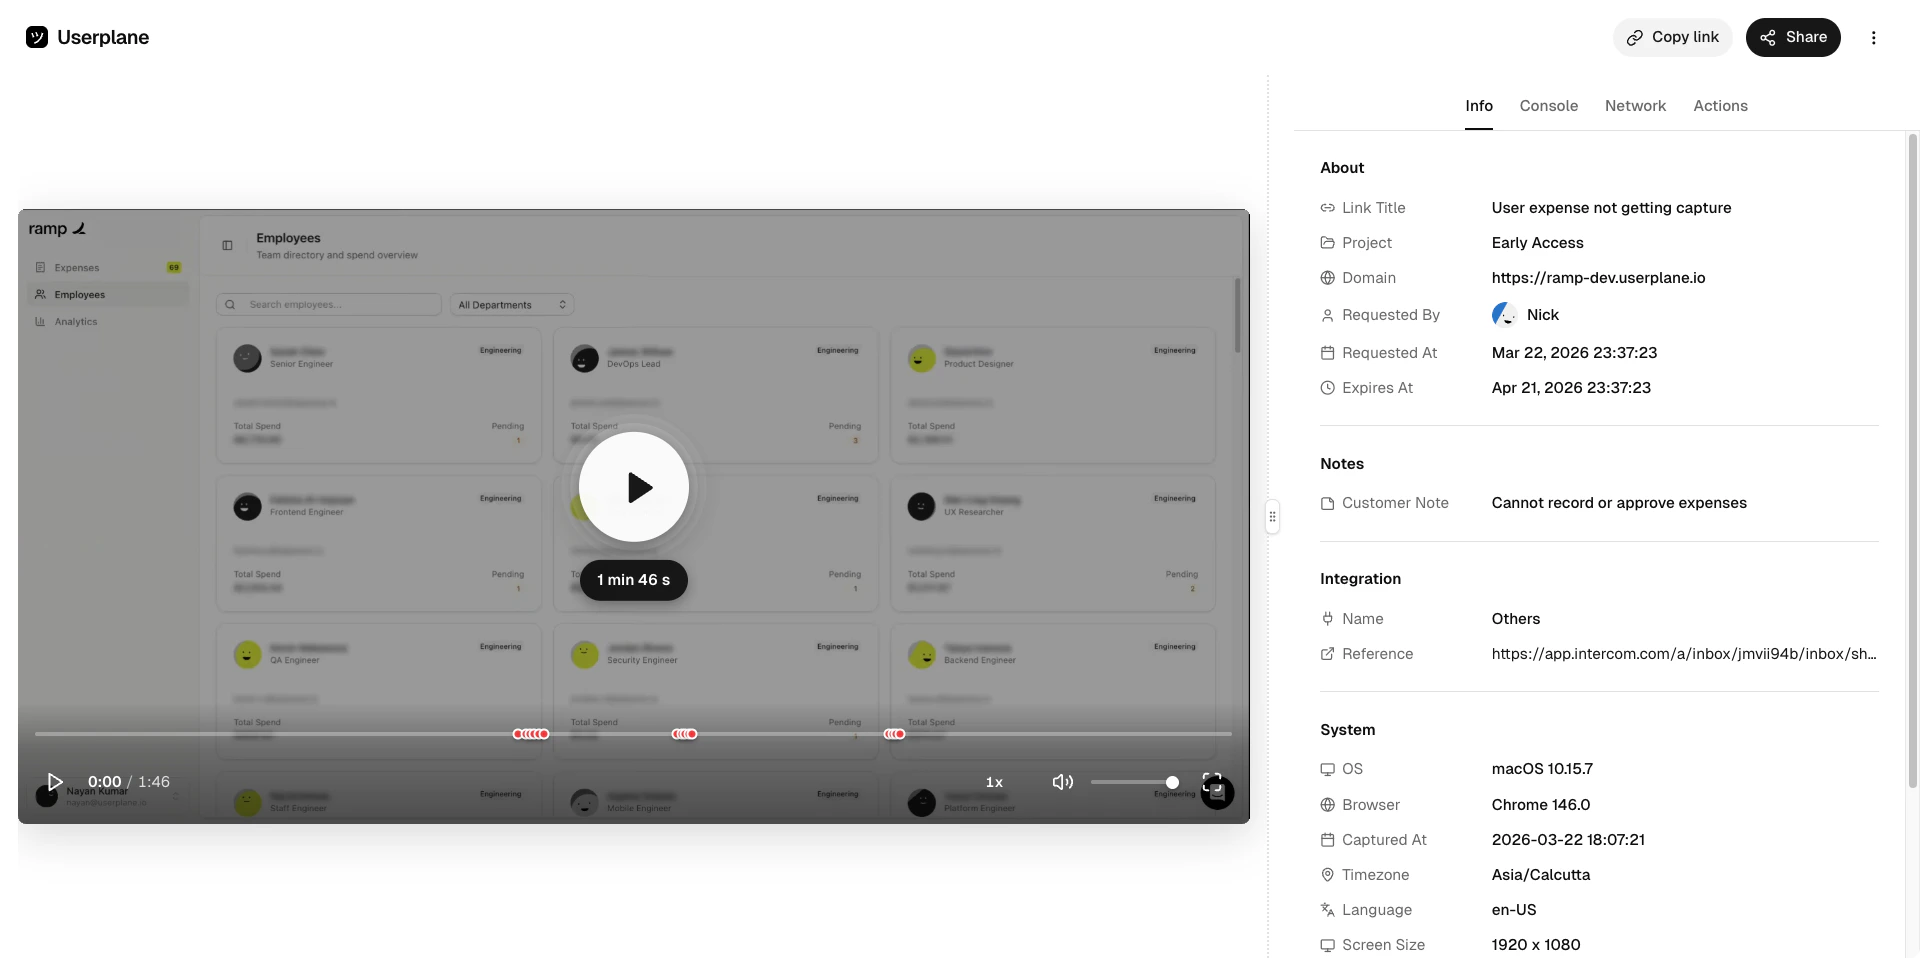
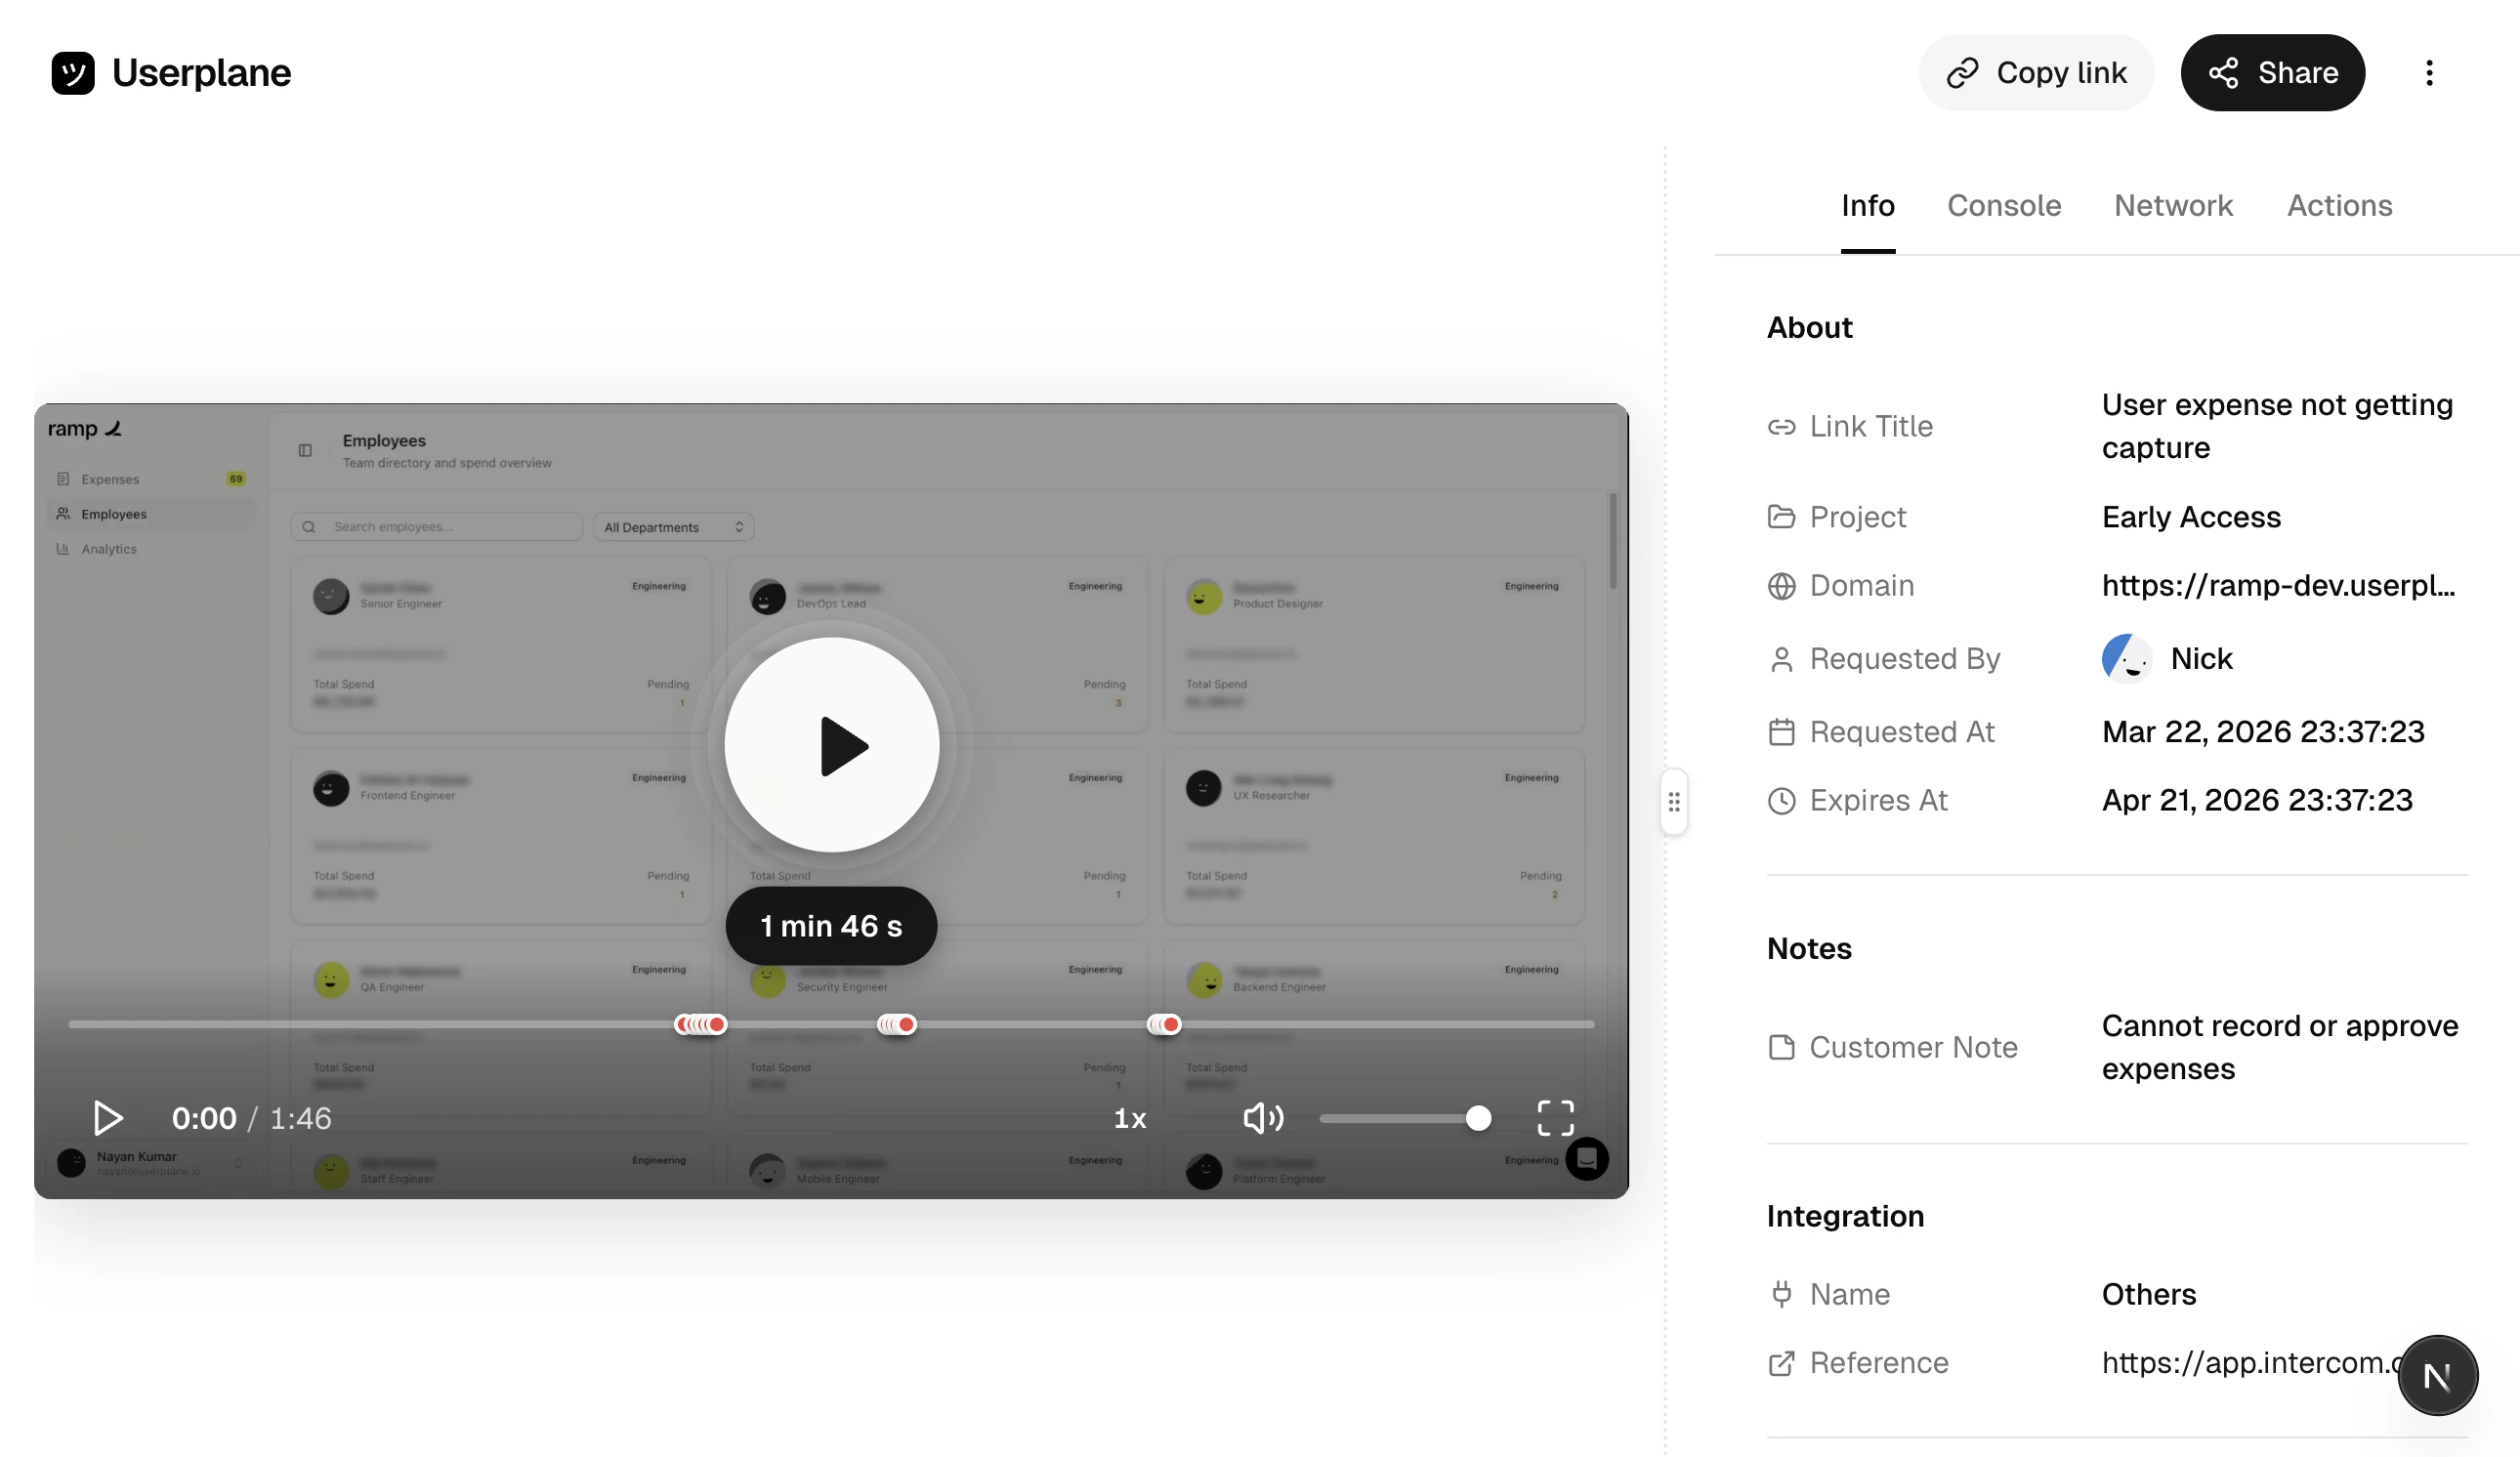
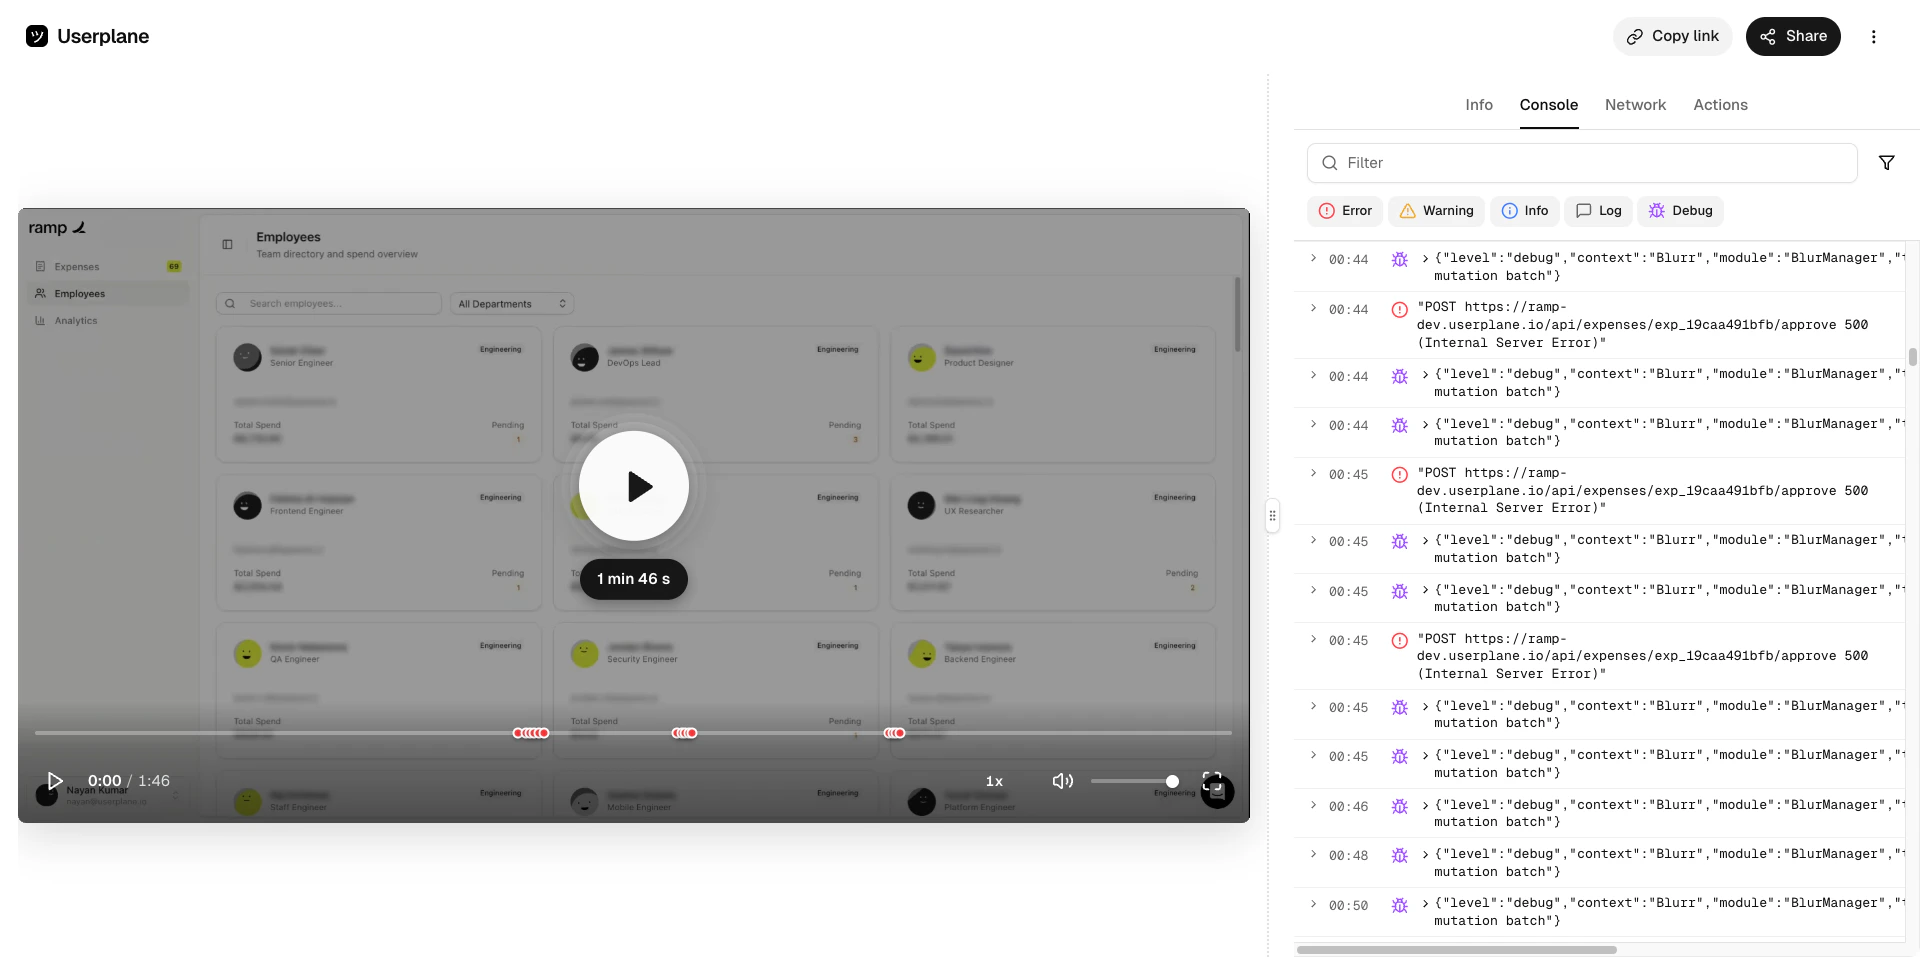
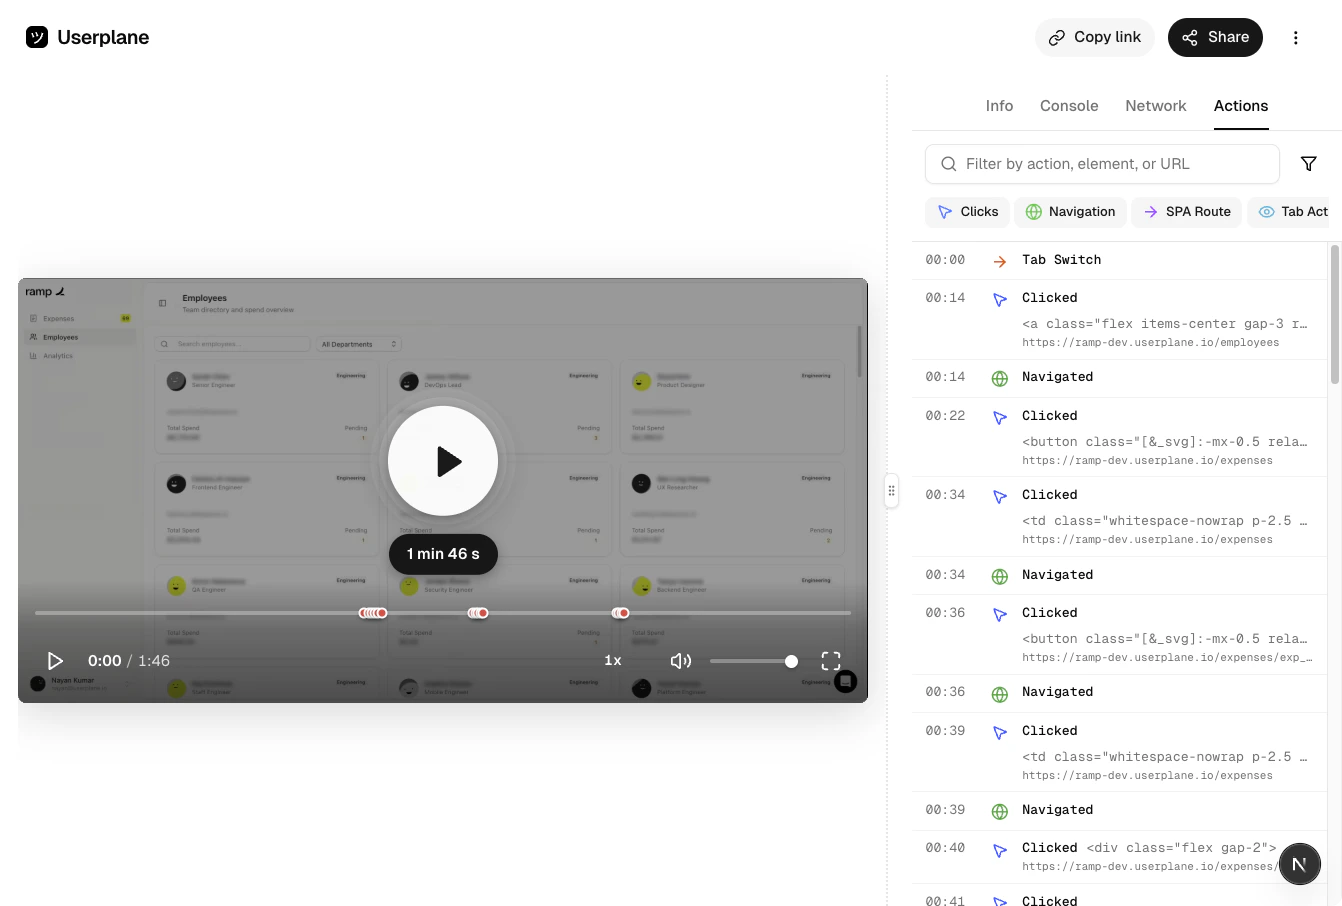
The recording detail view is where you watch a customer’s screen recording and review the technical data captured alongside it — console logs, network requests, user actions, and metadata — all synchronized with the video timeline.
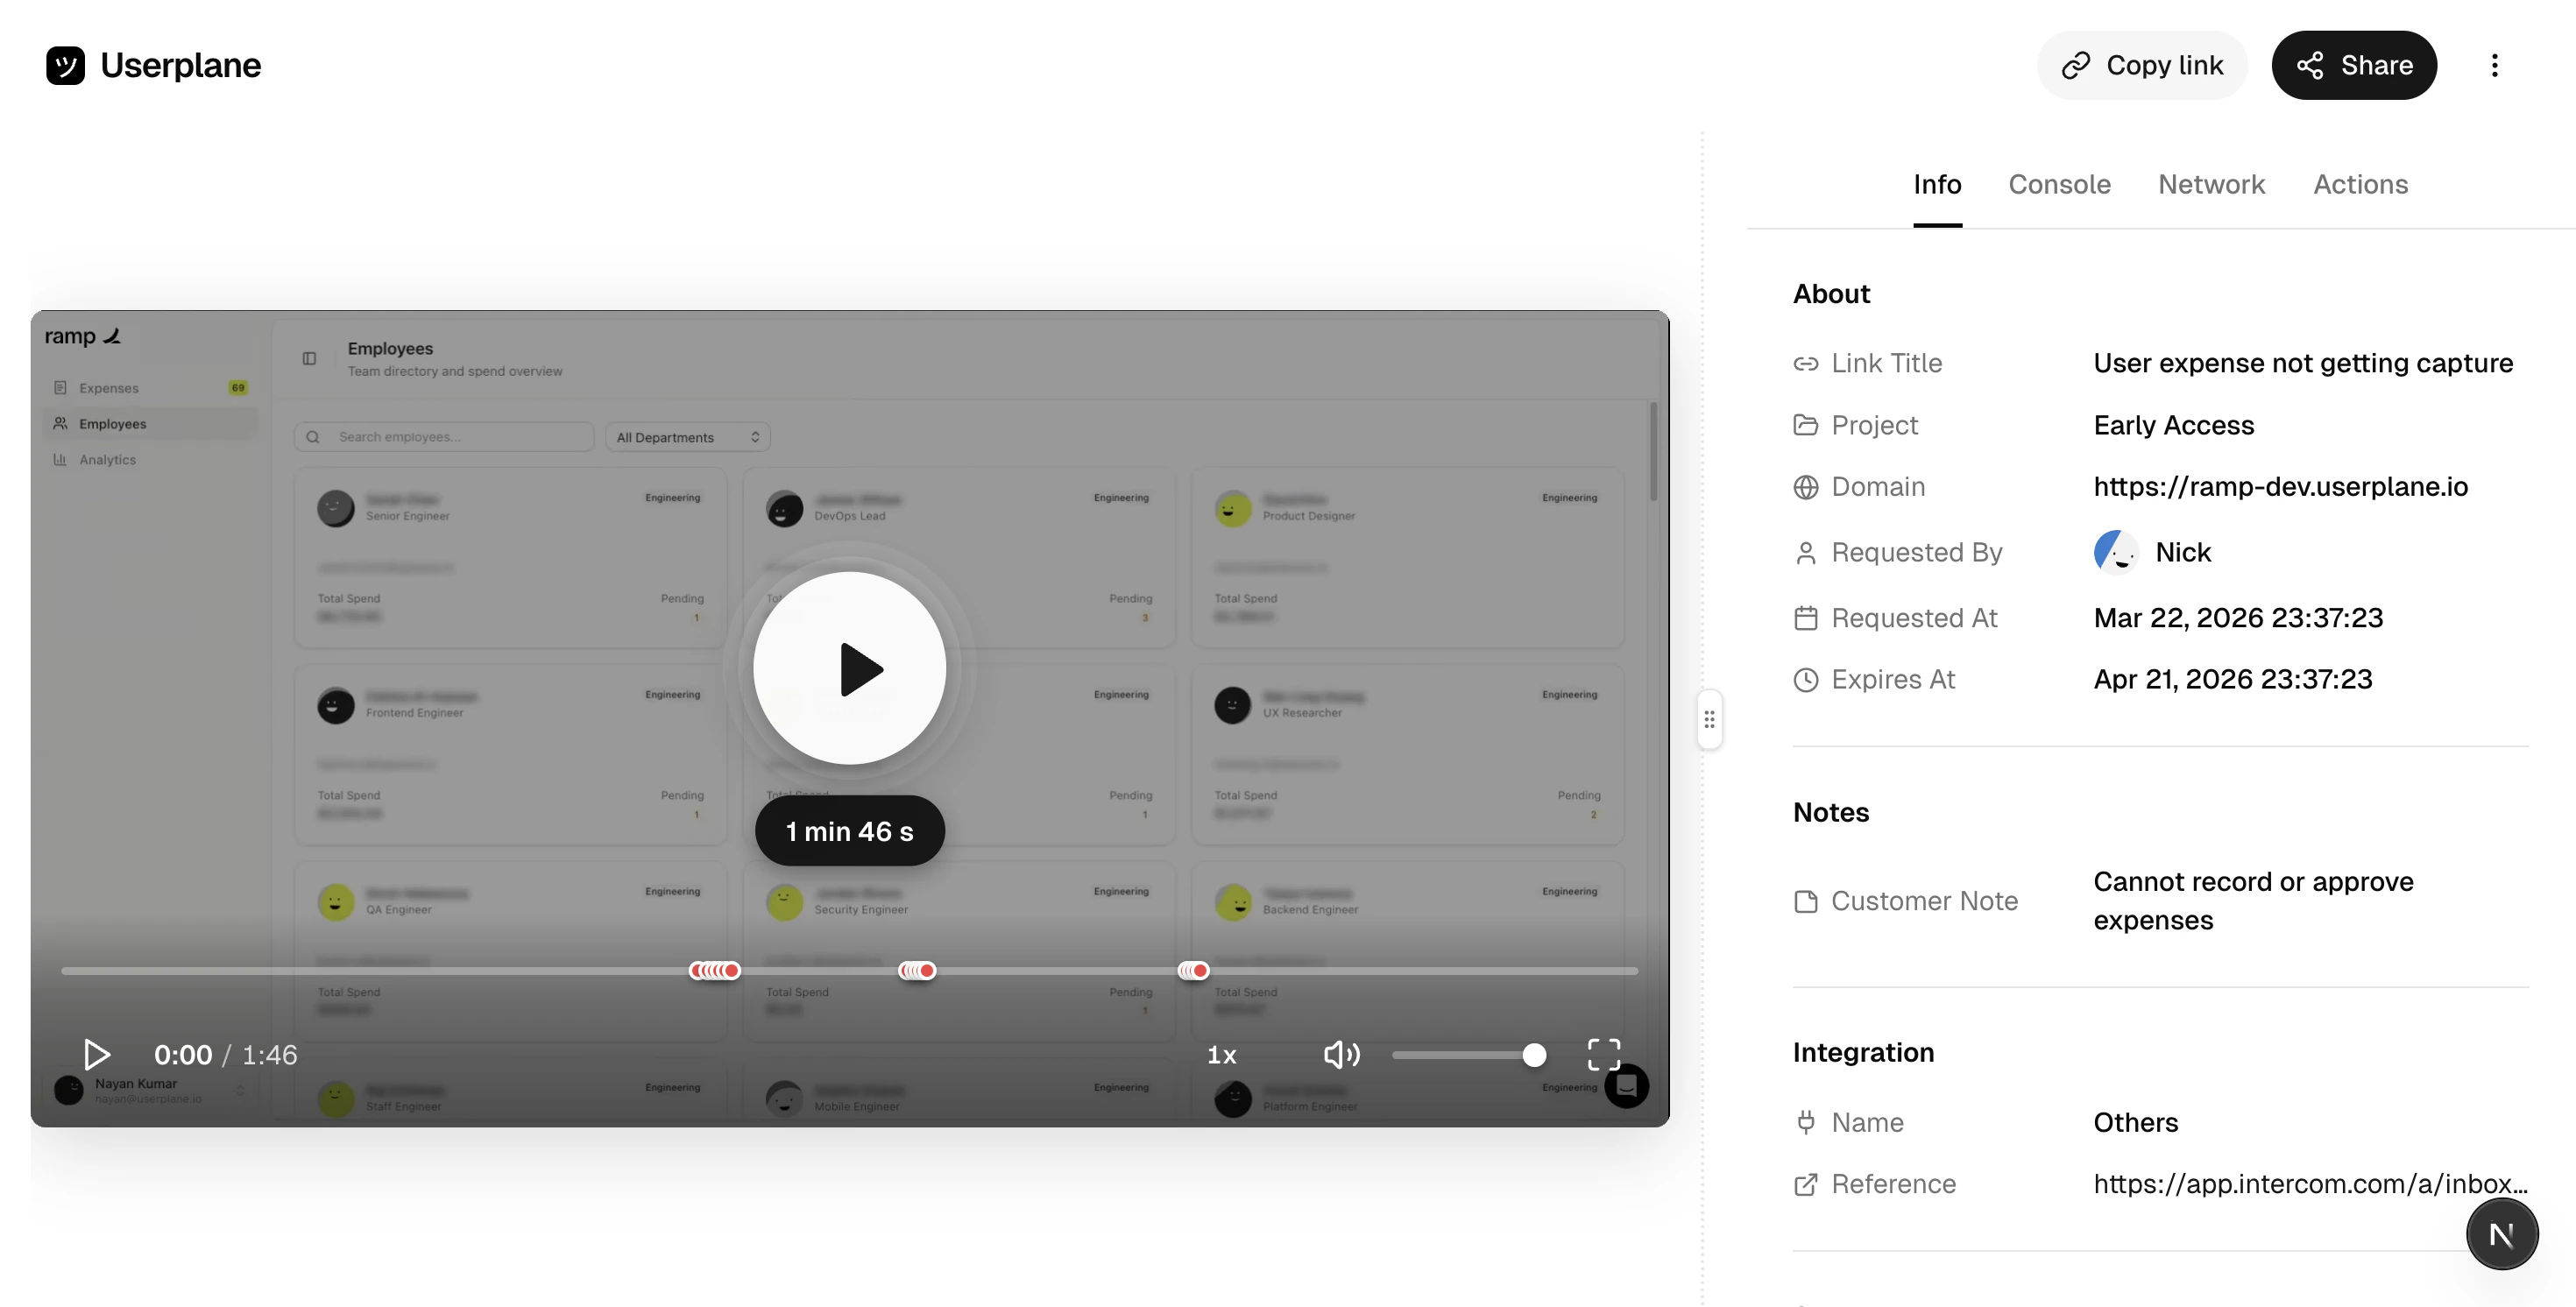
Left panel — the video player. Play, pause, scrub, and resize as needed.
Right panel — tabbed panels for inspecting recording data.
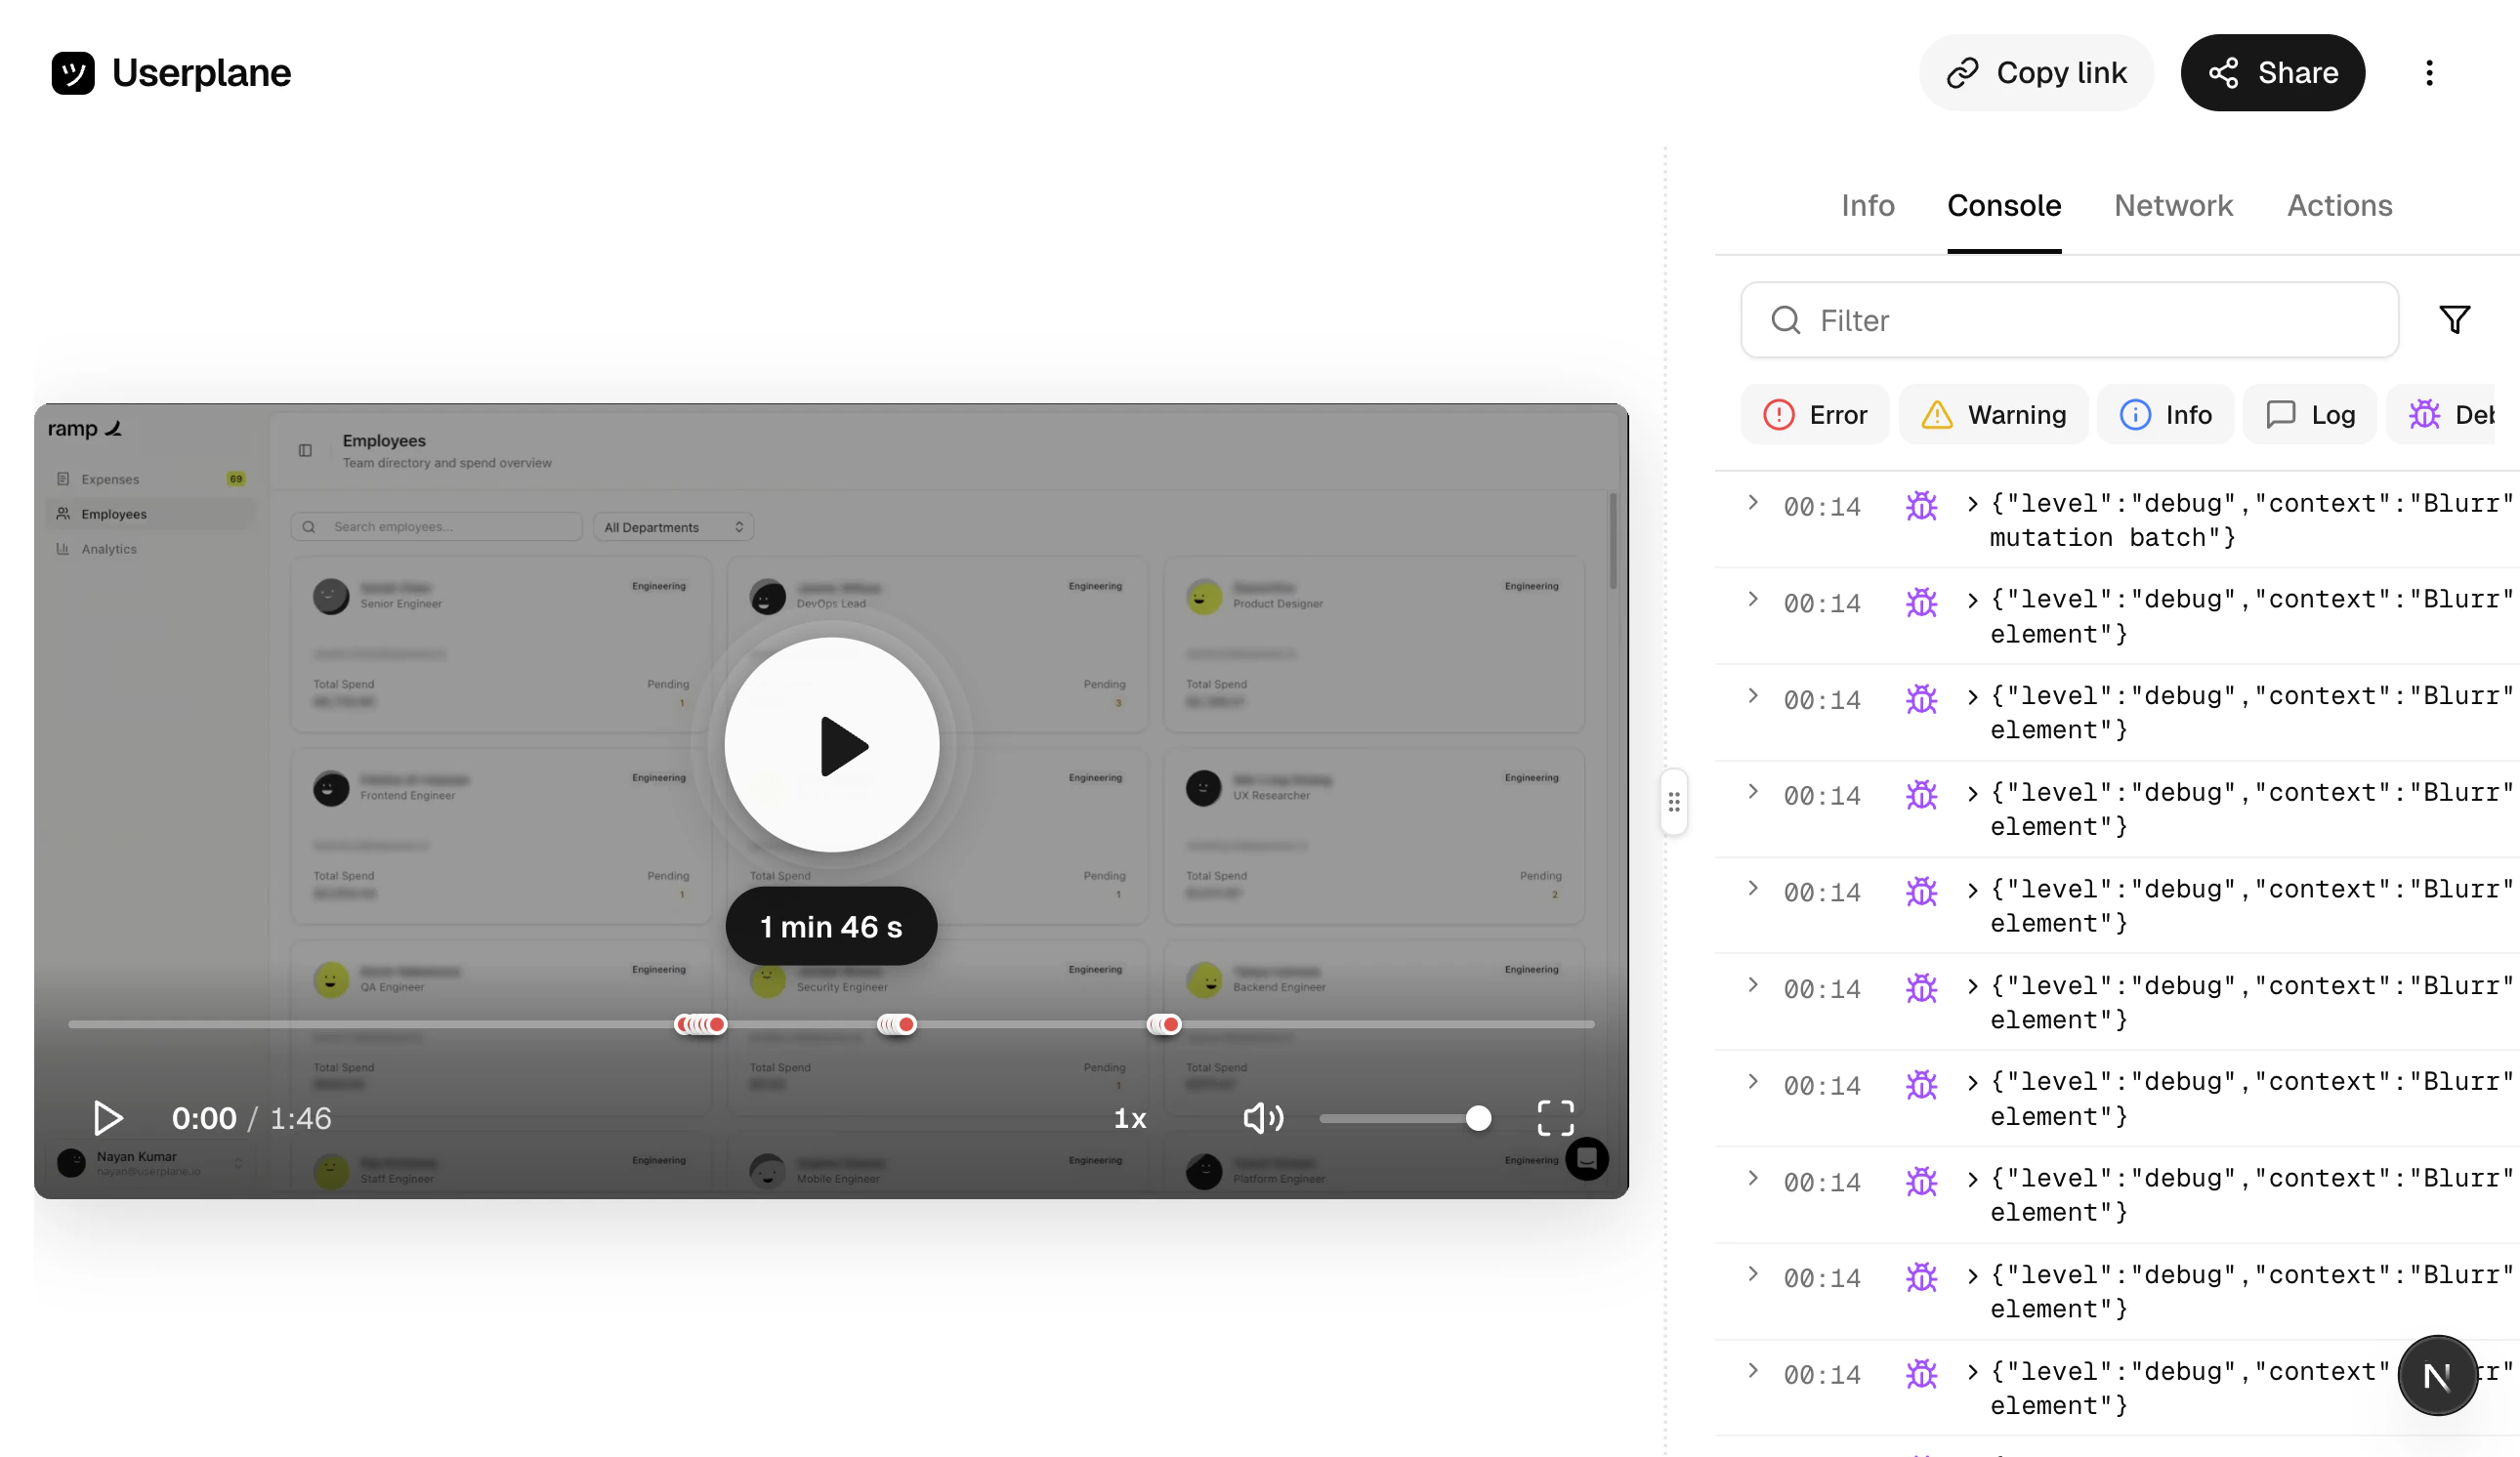
Drag the divider between panels to adjust the split. The video and the right-panel data stay in sync — clicking a console error or network request jumps the video to the moment it happened.
The video player supports standard playback controls — play, pause, scrub, and speed adjustment. Recordings are captured using the best codec available in the customer’s browser (AV1, VP9, H.264, or VP8). When voice and device audio was captured, audio plays back in sync with the video.As you watch, the right panel highlights the data entries that correspond to the current playback position — so you can see which console errors, network requests, or user actions occurred at any moment.
The right panel contains several tabs, each showing a different type of captured data:
Tab
What it shows
Info
Link details, project, domain, who requested it, customer notes, system metadata, and custom metadata
Console
Browser console logs — errors, warnings, and messages
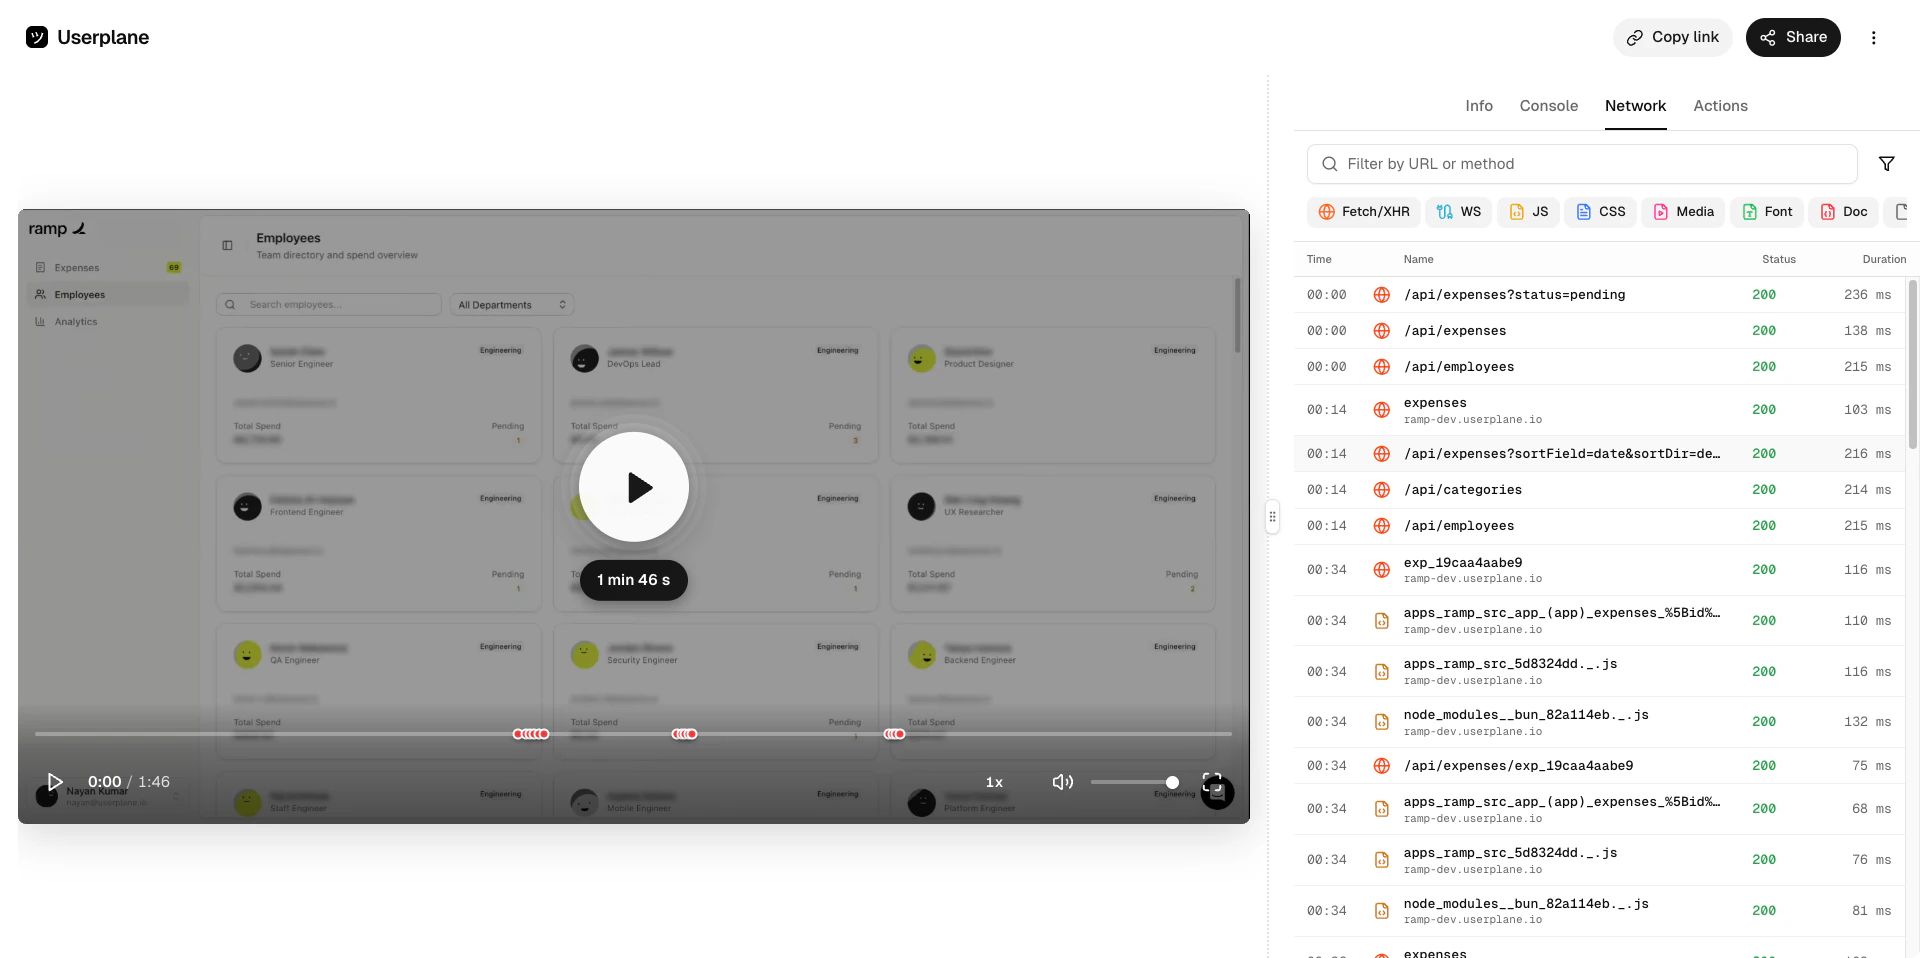
Network
HTTP requests with timing, status codes, and payloads
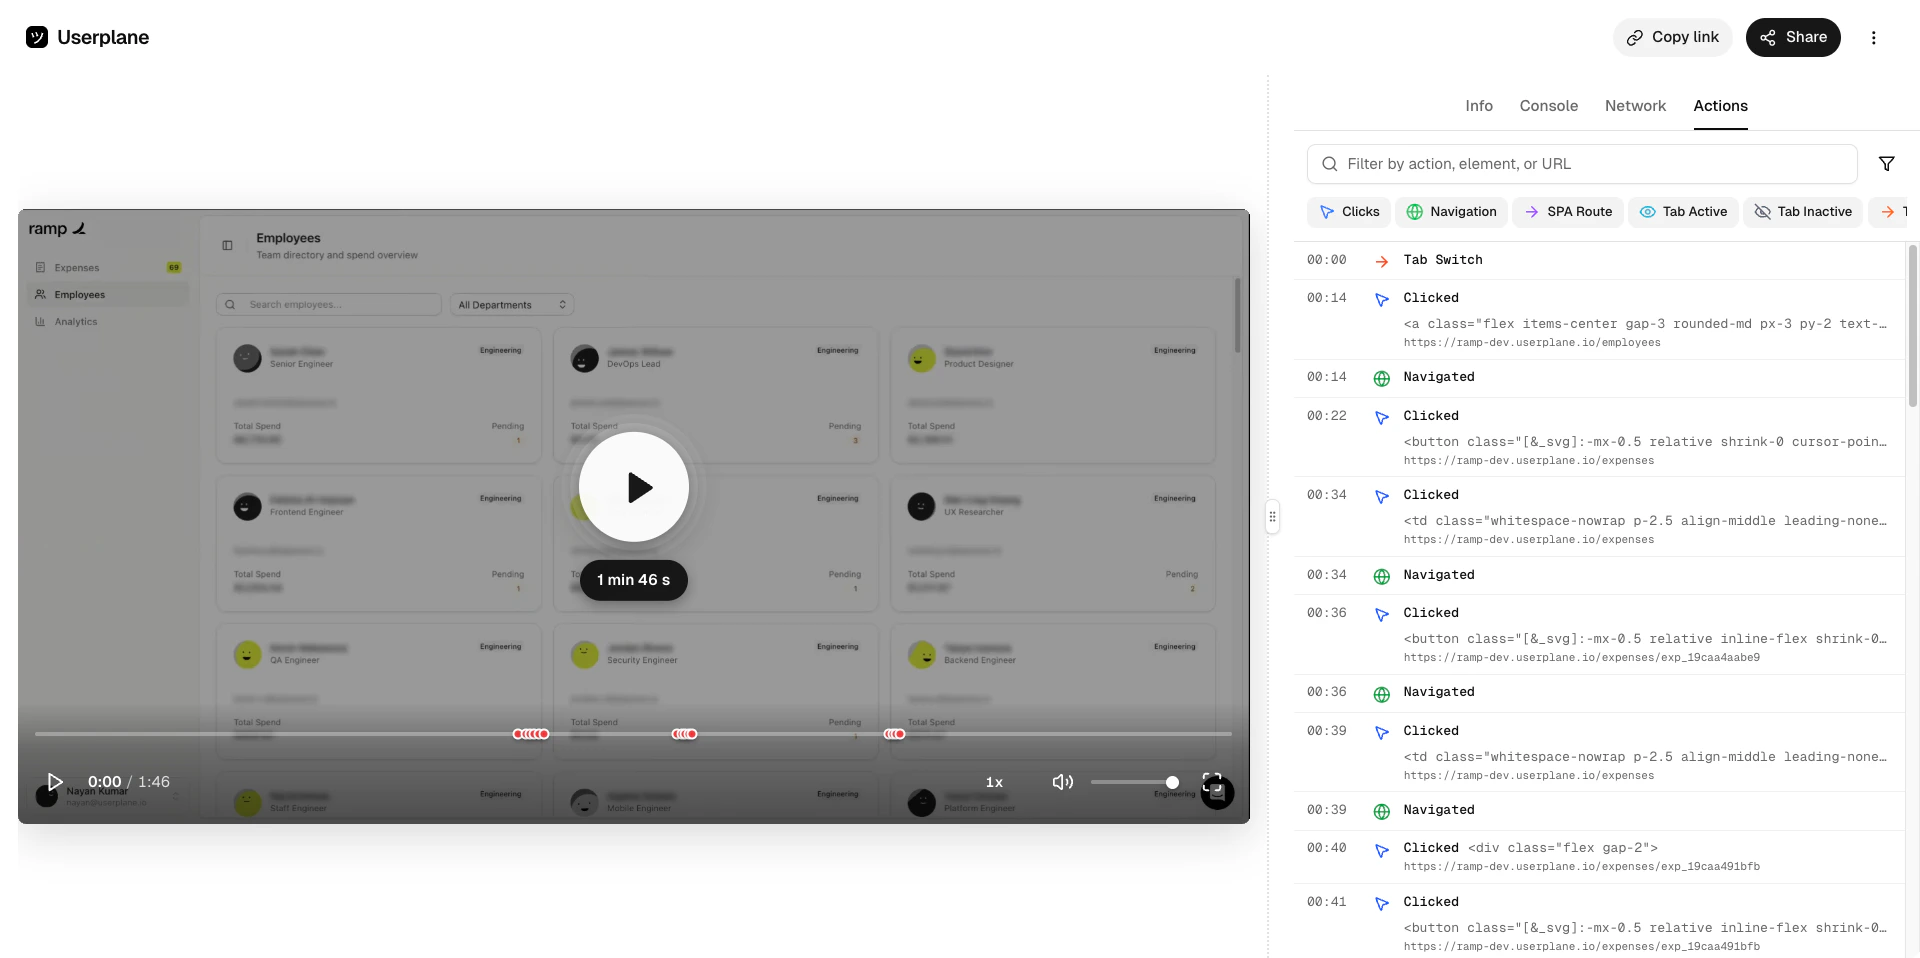
Actions
Client-side interactions — clicks, inputs, and page navigations
Not all panels appear for every recording. The available panels depend on which data types were
captured, which is determined by your domain recording
preferences.
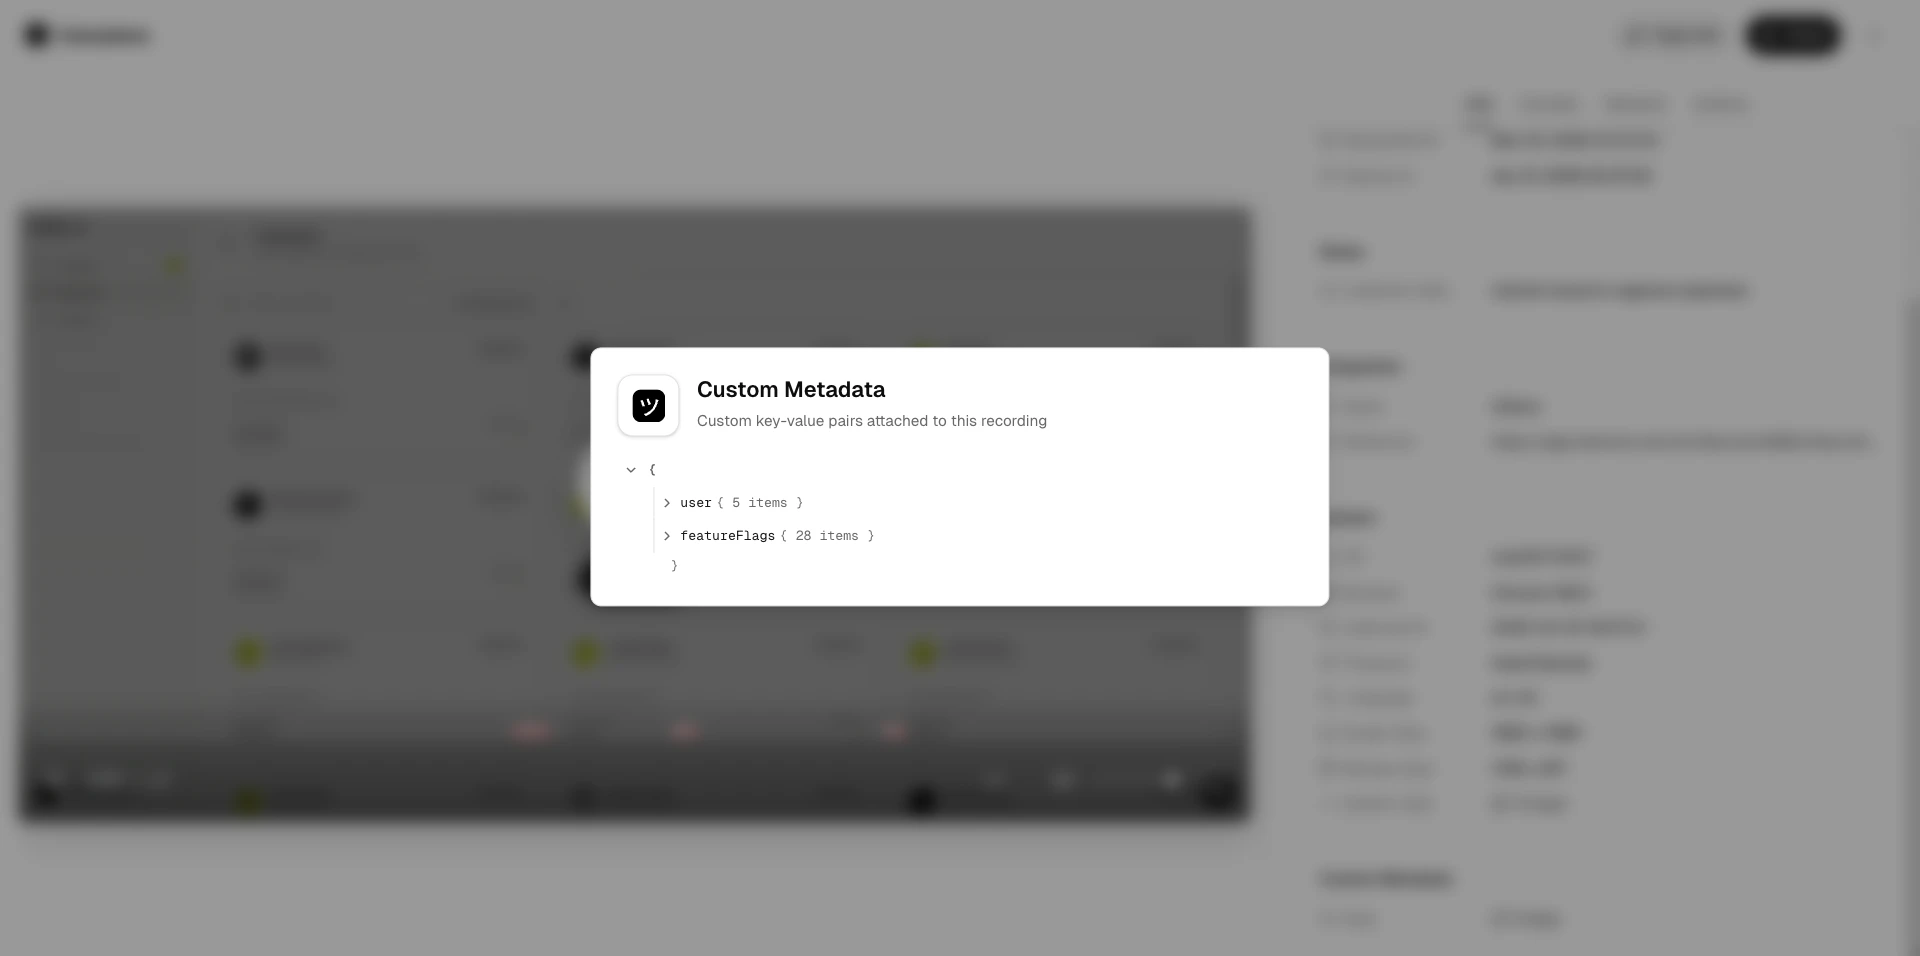
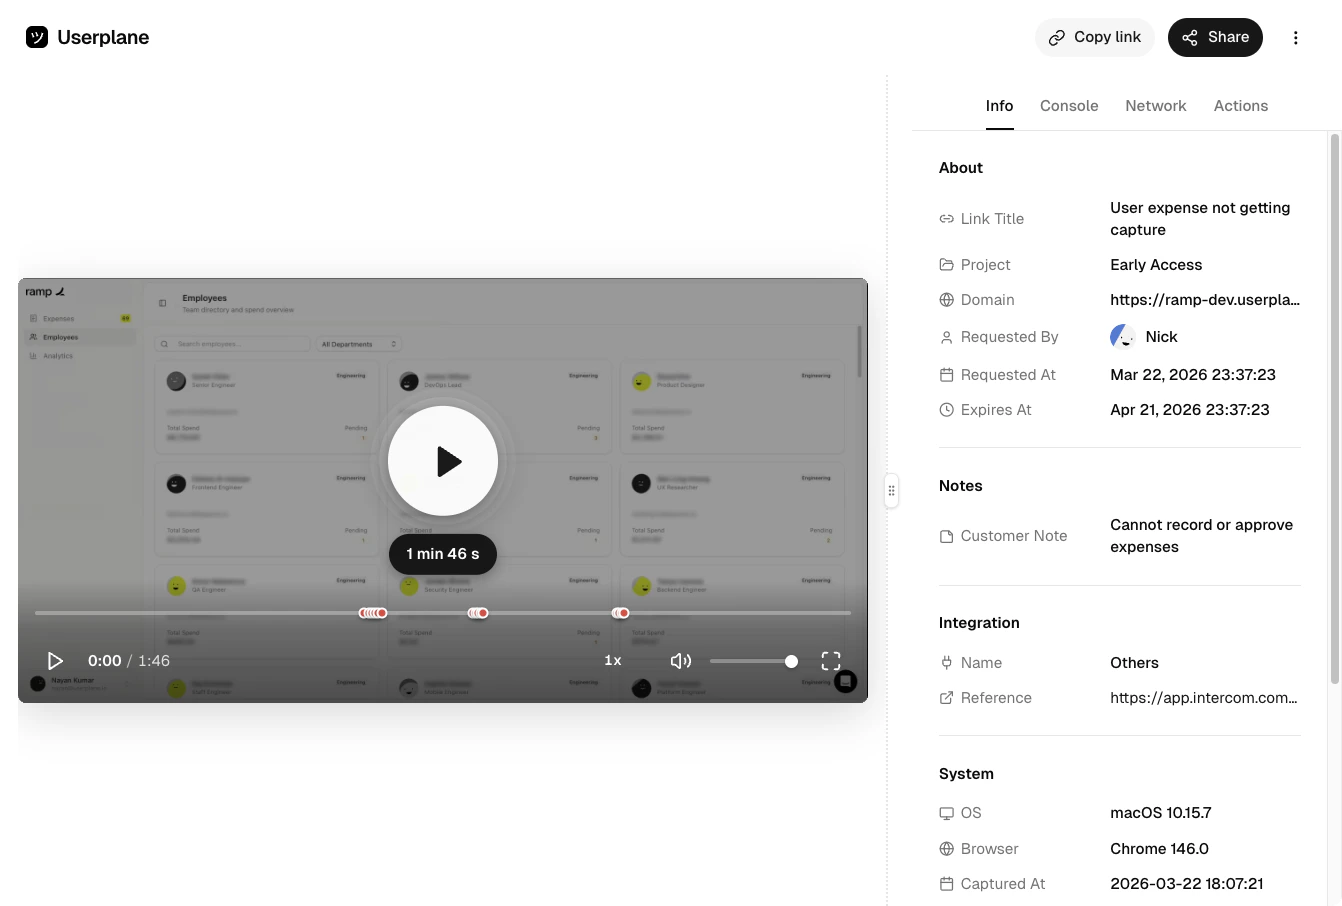
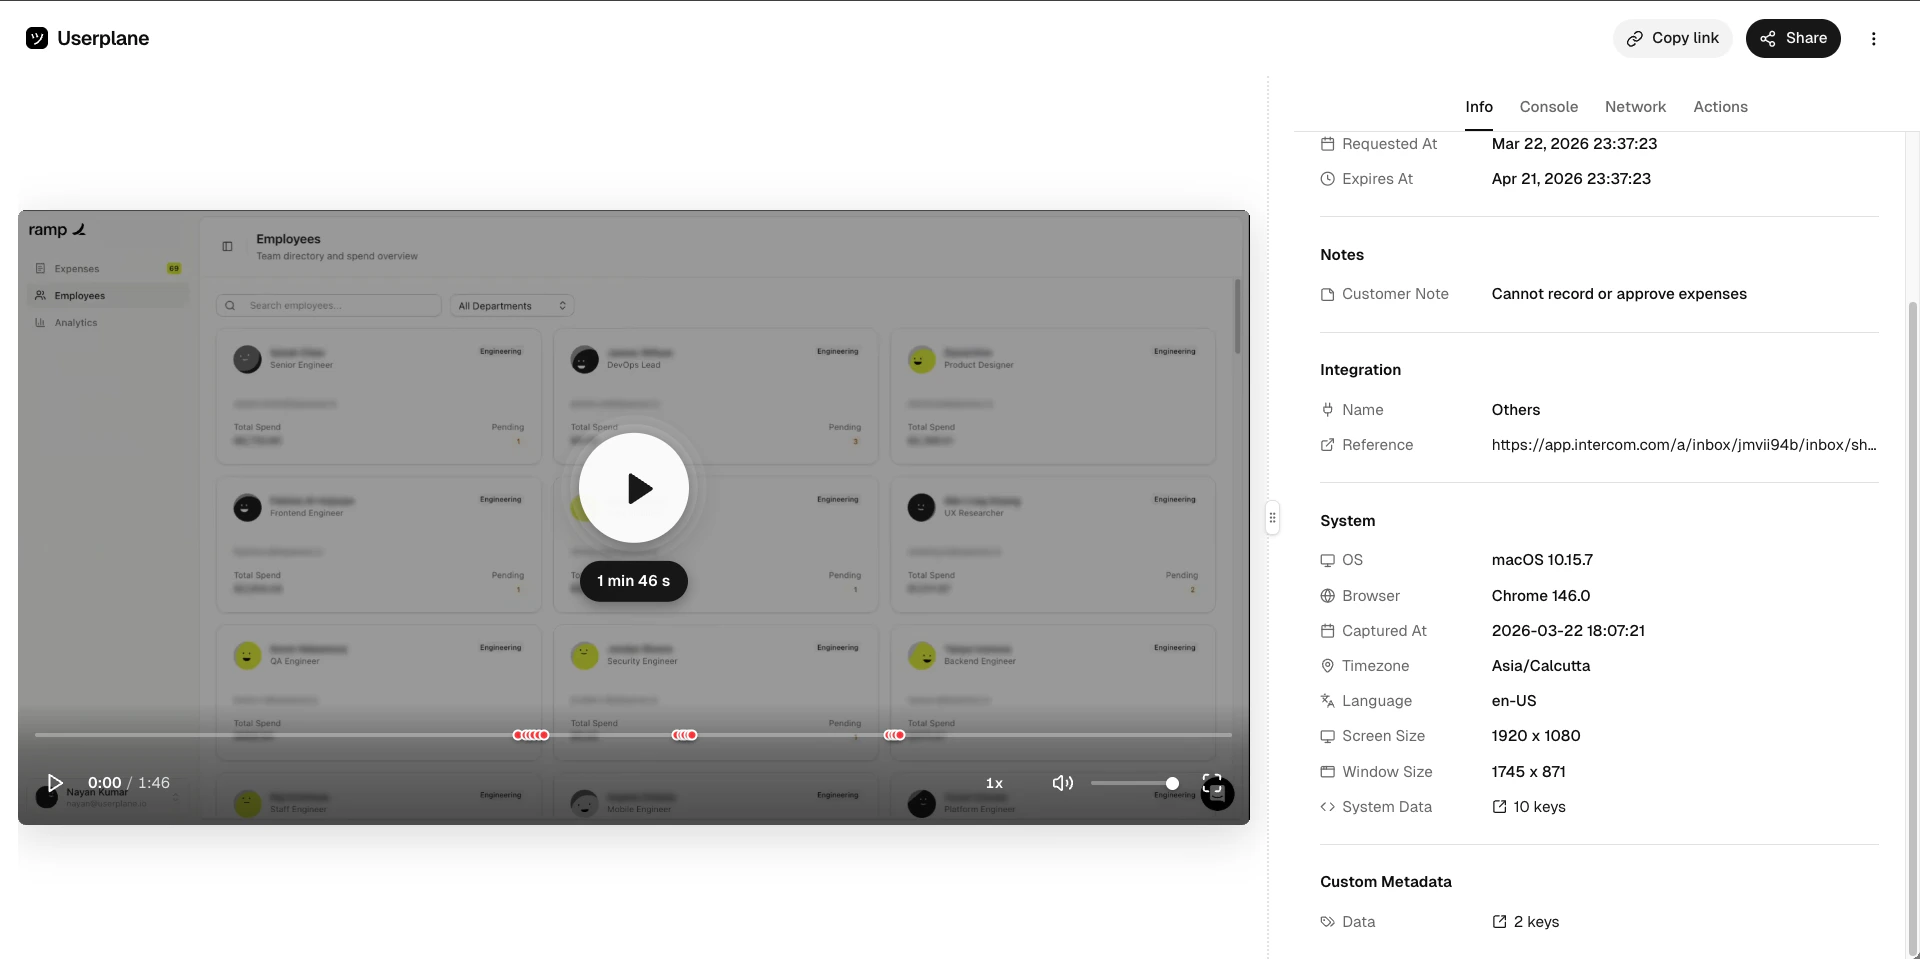
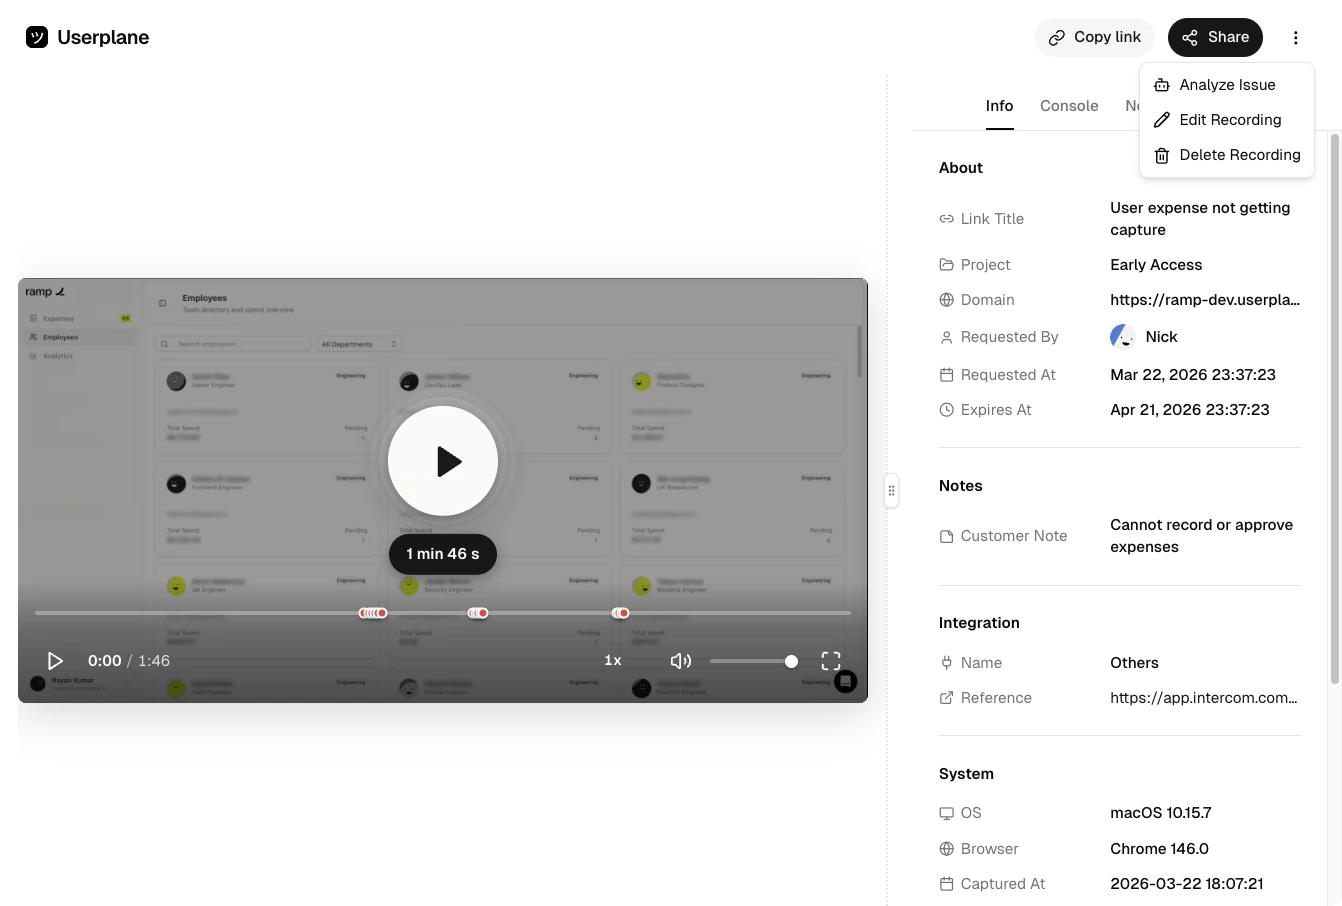
The Info panel shows everything about the recording that isn’t session data — who requested it, which project and domain it belongs to, any notes the customer added, and both system and custom metadata.Custom metadata is set via the Metadata SDK and can include user IDs, account names, feature flags, or any key-value pairs your app attaches to the session.
Key-value pairs attached to the recording via the Metadata SDK — user IDs, account names, feature flags, or any application-specific context your app sends with the session.
Custom metadata expanded
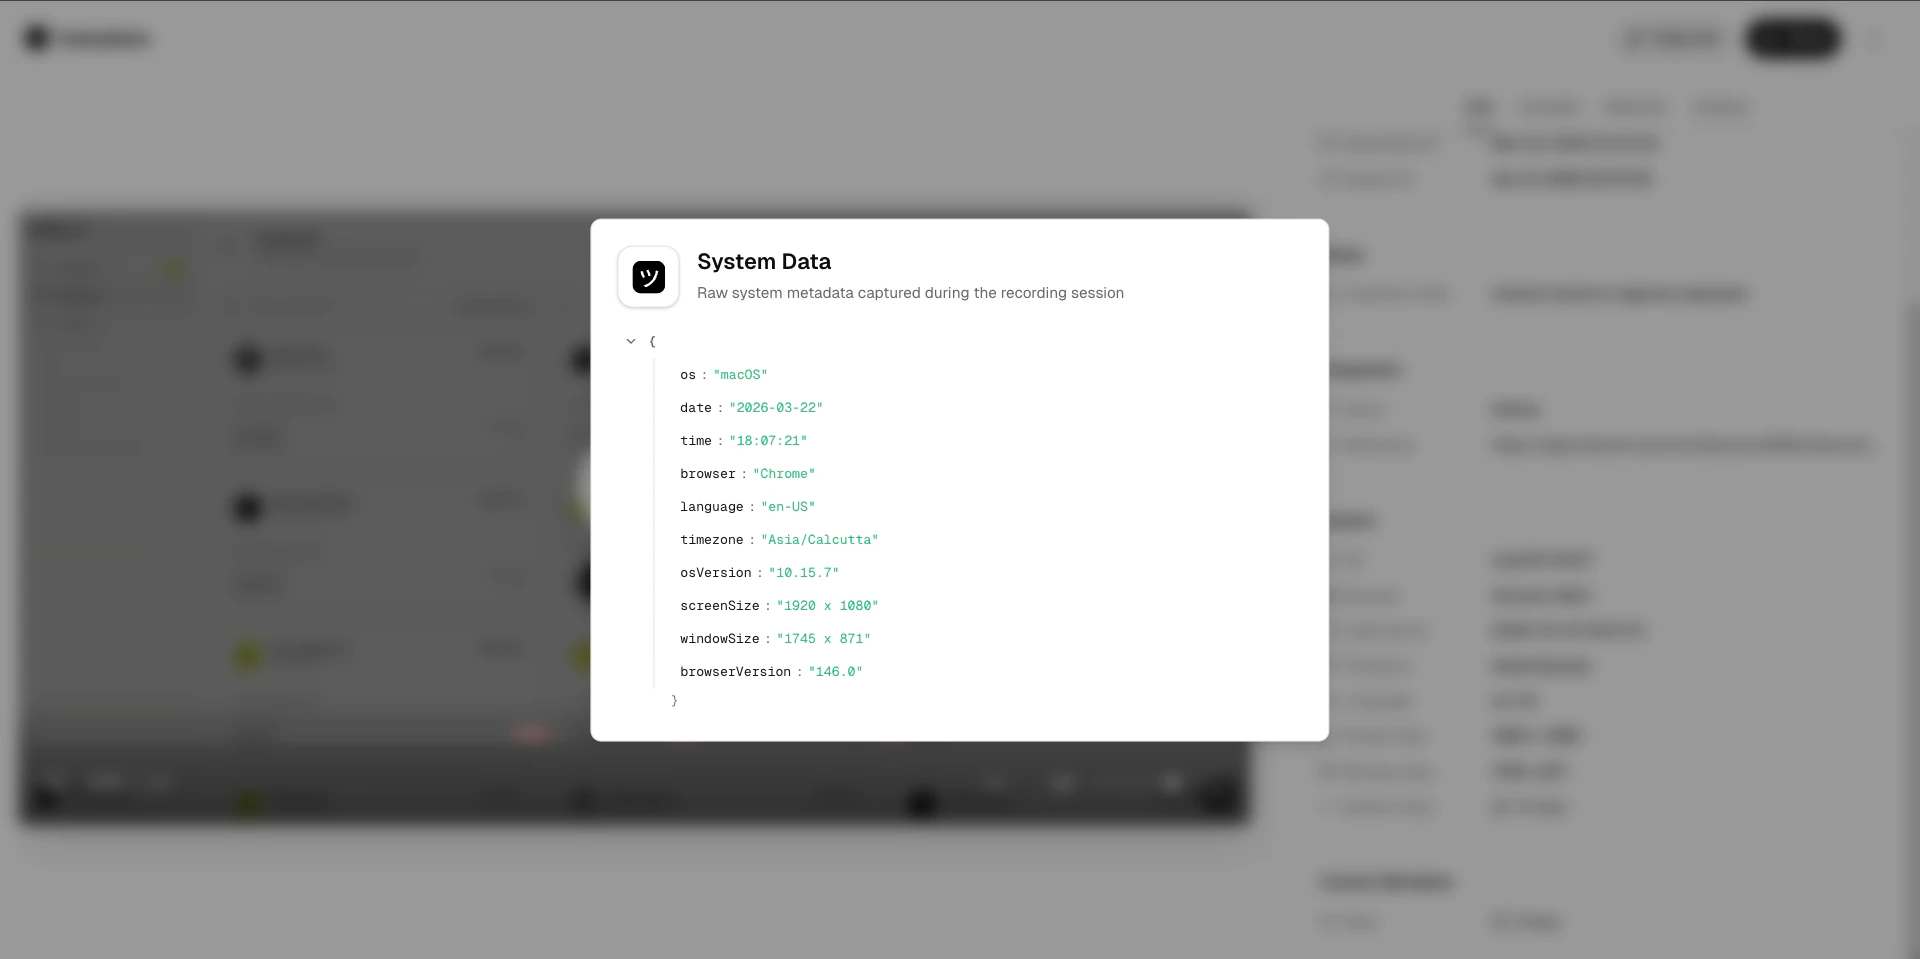
Automatically detected system information — browser name and version, operating system, screen resolution, and device type.
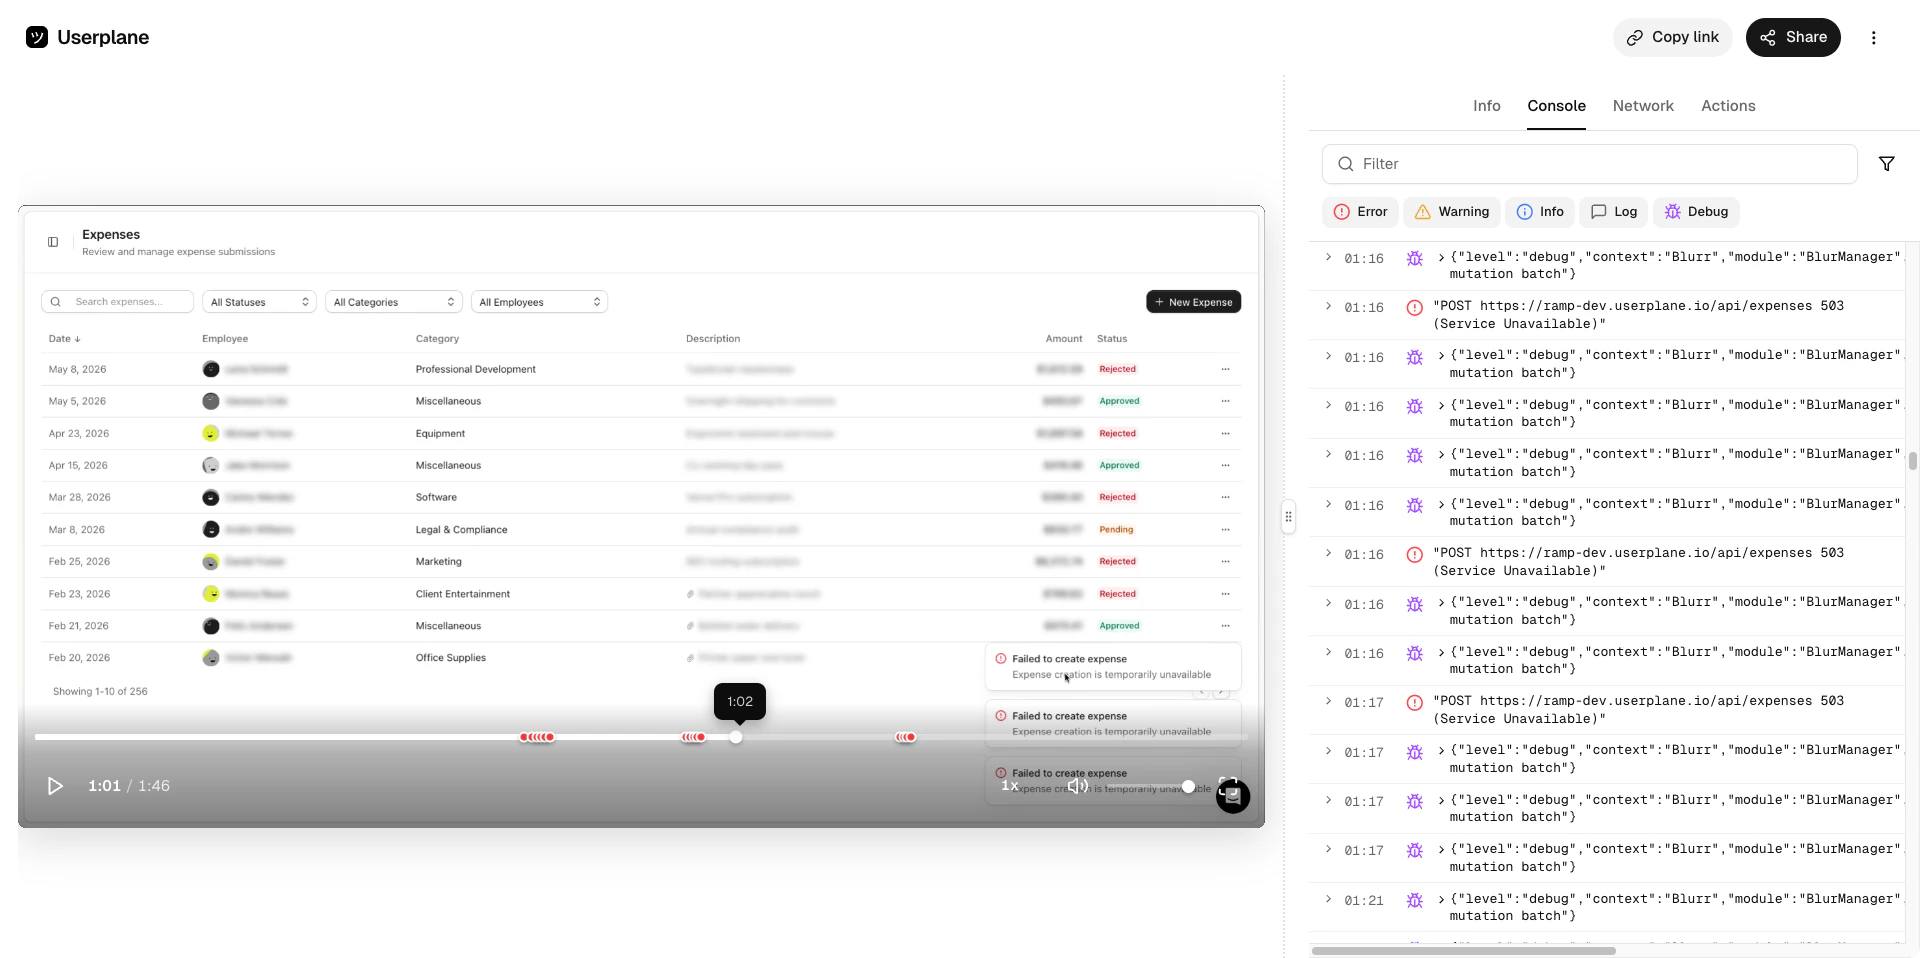
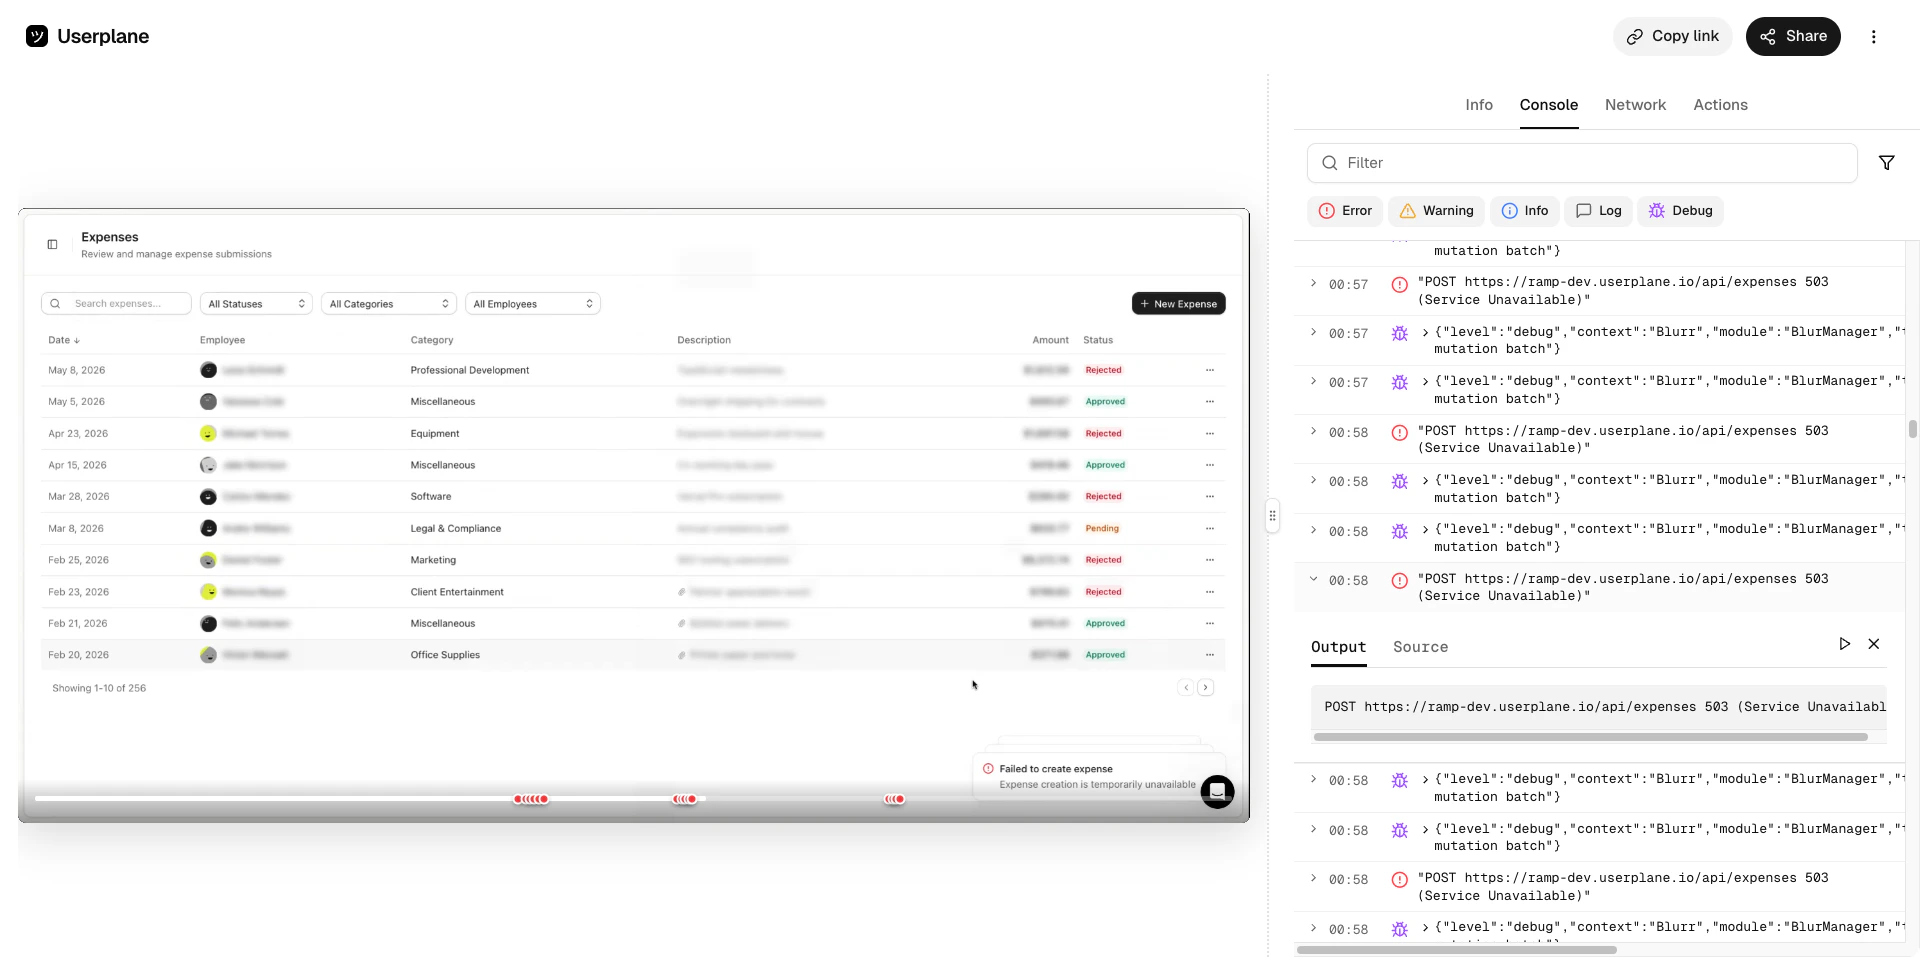
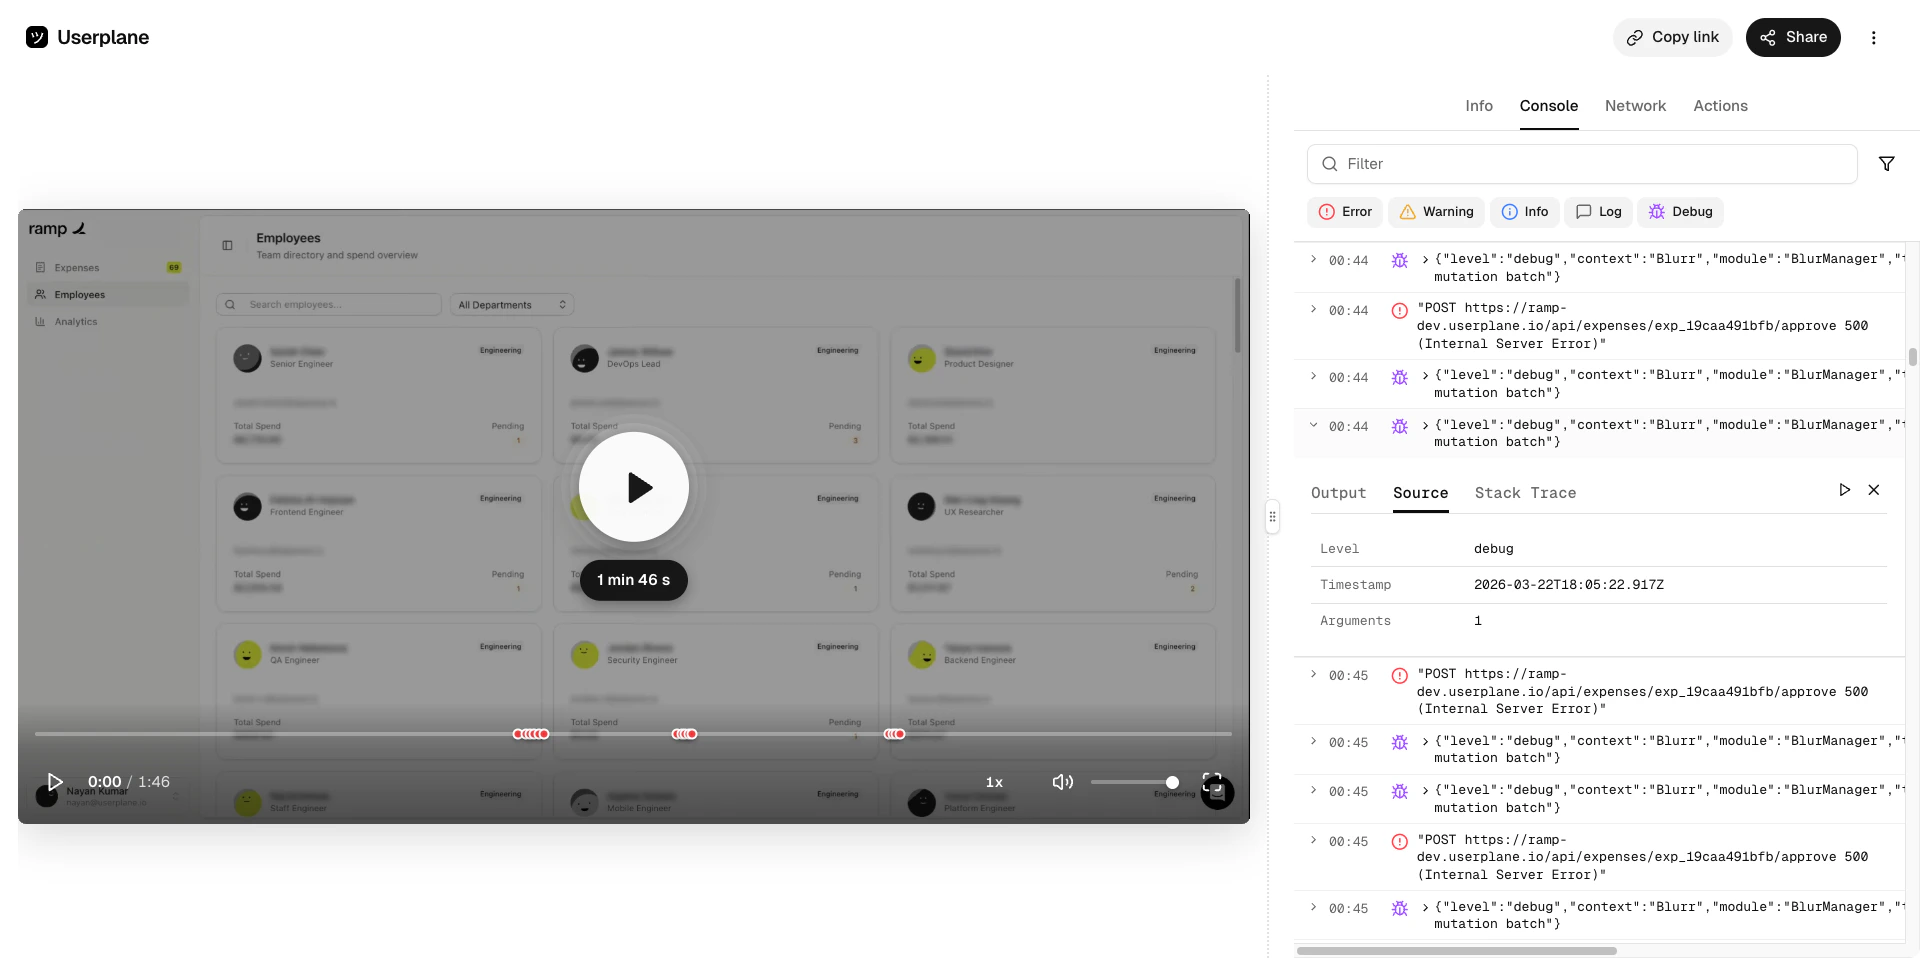
The Console panel captures browser console output — errors, warnings, info, and debug messages — exactly as they appeared in the customer’s browser. Each entry includes the log level, message, source file location, and a full stack trace when available.Click any entry to expand it and see the output, source, and stack trace. Clicking an entry also jumps the video to the moment the log was emitted.
Recording details
Error logs
Other logs
Synced with playback
The console list shows all captured log entries chronologically, color-coded by level. Click any entry to expand it and see the full output, source, and stack trace.
Console log list
Console panel
Errors are highlighted for quick identification. Expand an error to see the full message and stack trace.
Console error — output
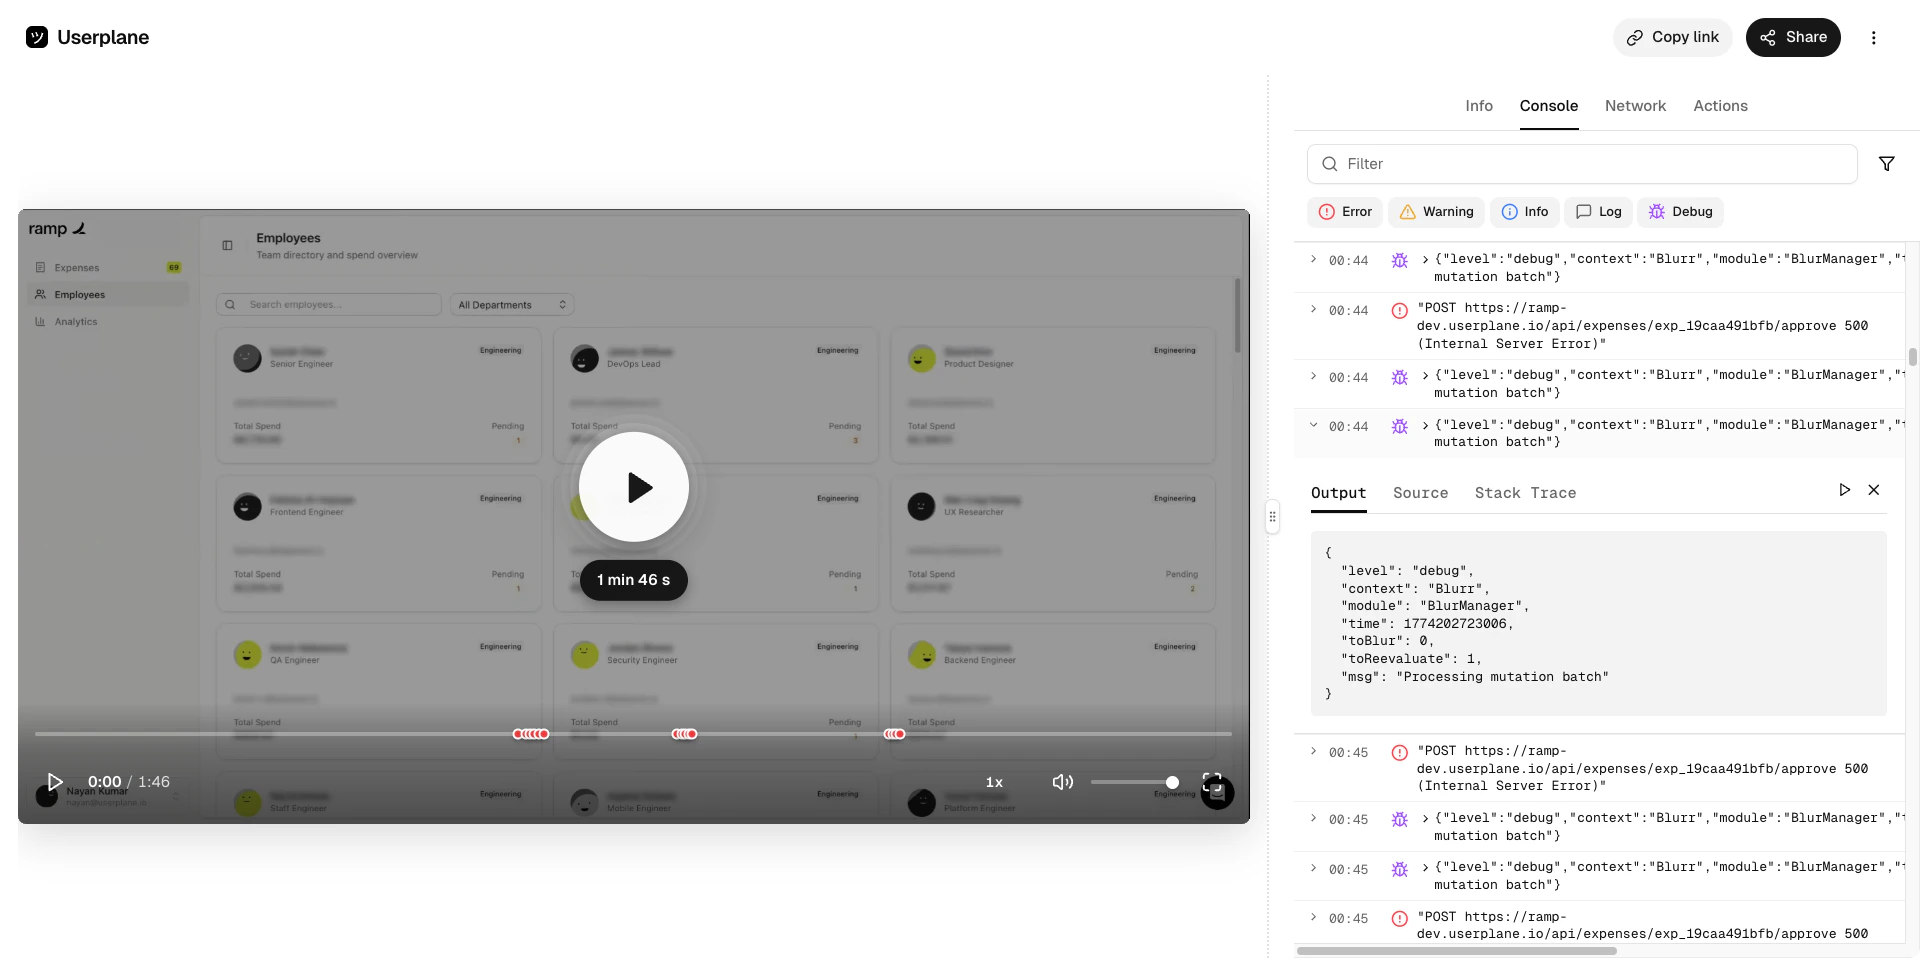
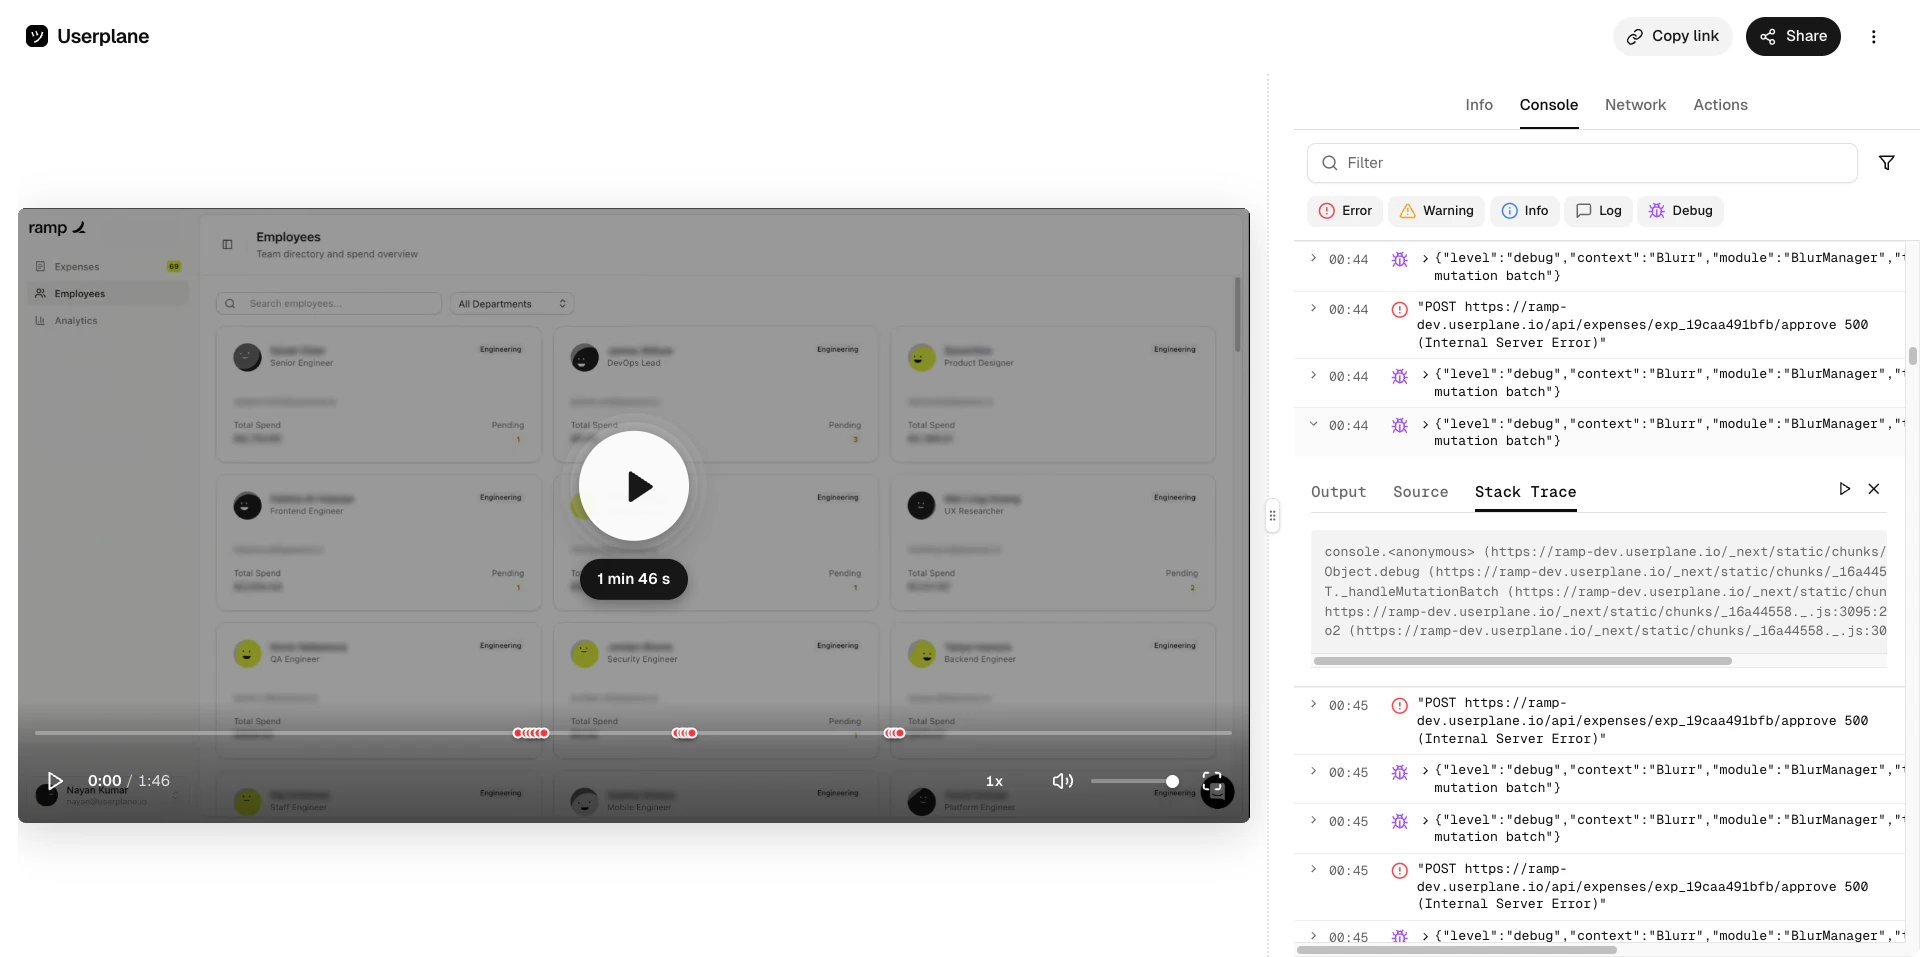
Debug, info, and warning entries include the output, source file, and stack trace — useful for tracing execution flow.
Debug log — output
Debug log — source
Debug log — stack trace
Console entries stay in sync with the video timeline. As the video plays, the active log entry is highlighted — and clicking any entry jumps the video to the moment it was emitted.
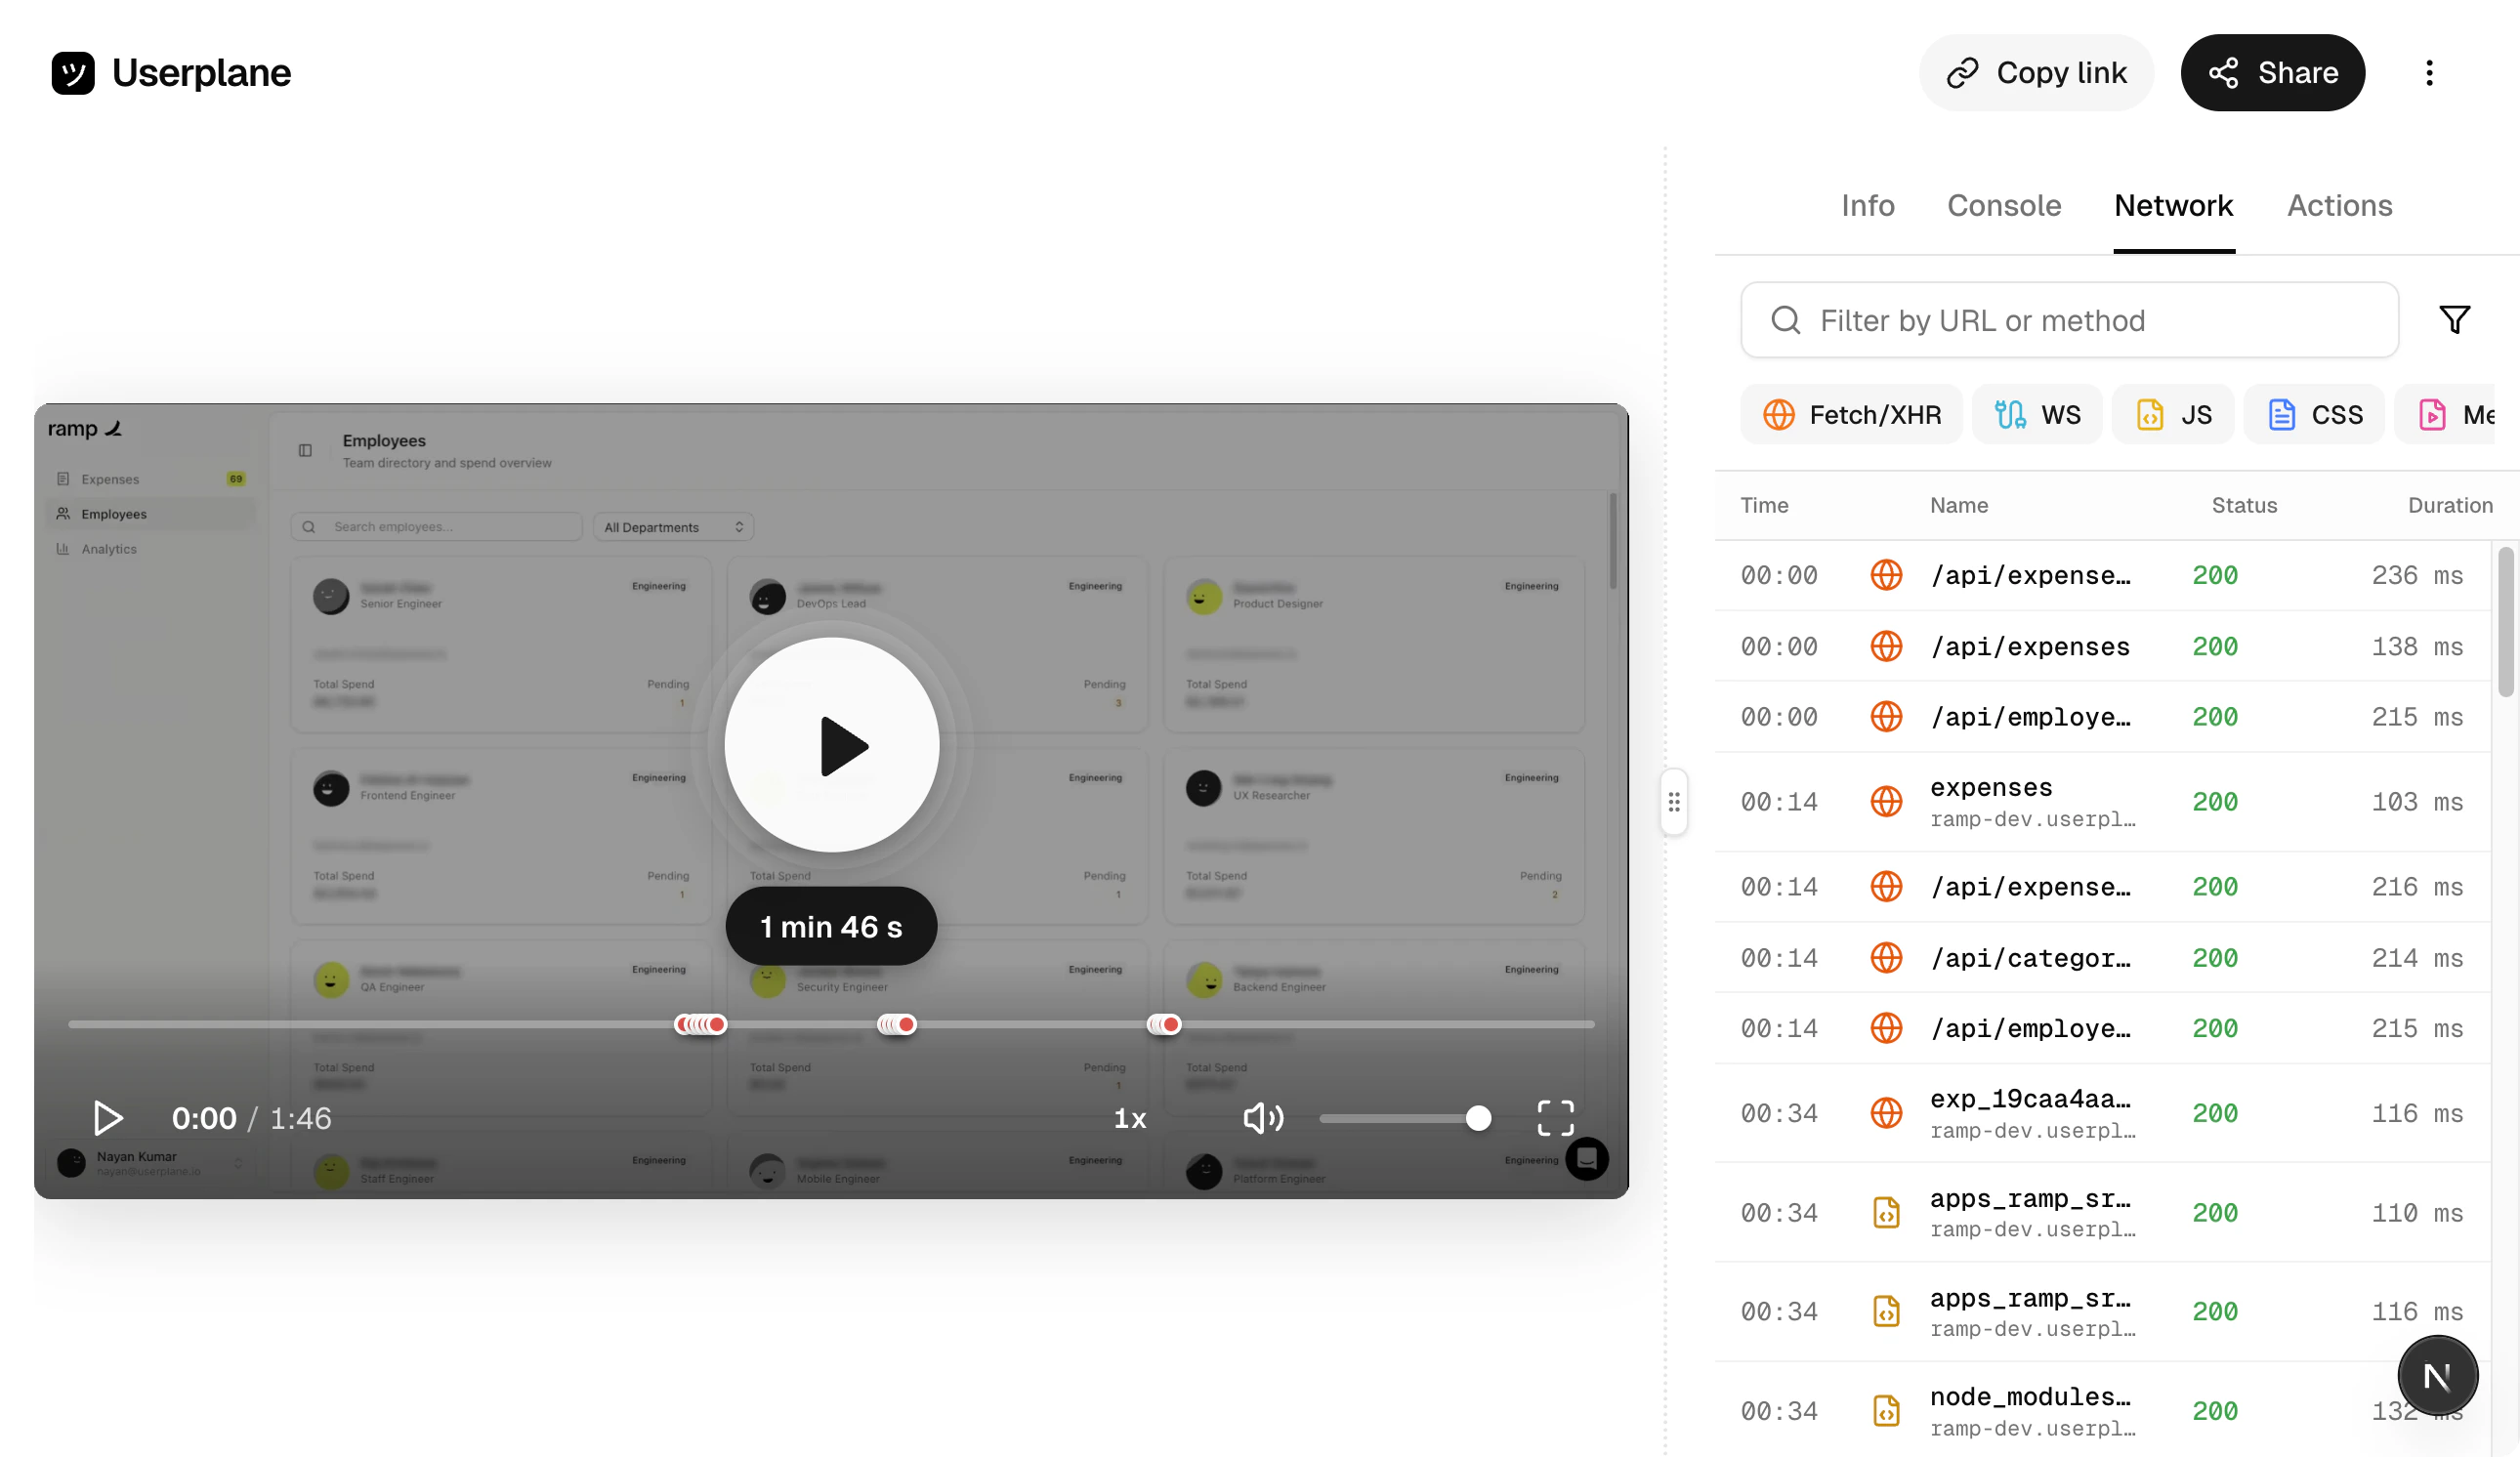
The Network panel captures HTTP requests made during the recording — method, URL, status code, timing, headers, and request/response payloads. Use it to identify failed API calls, slow responses, or unexpected payloads.The list view shows all requests chronologically. Click any request to open the detail view with full headers and body content.
Recording details
Request detail
Synced with playback
The request list shows all captured HTTP requests chronologically — method, URL, status code, and timing. Click any request to open its detail view.
Network request list
Network panel
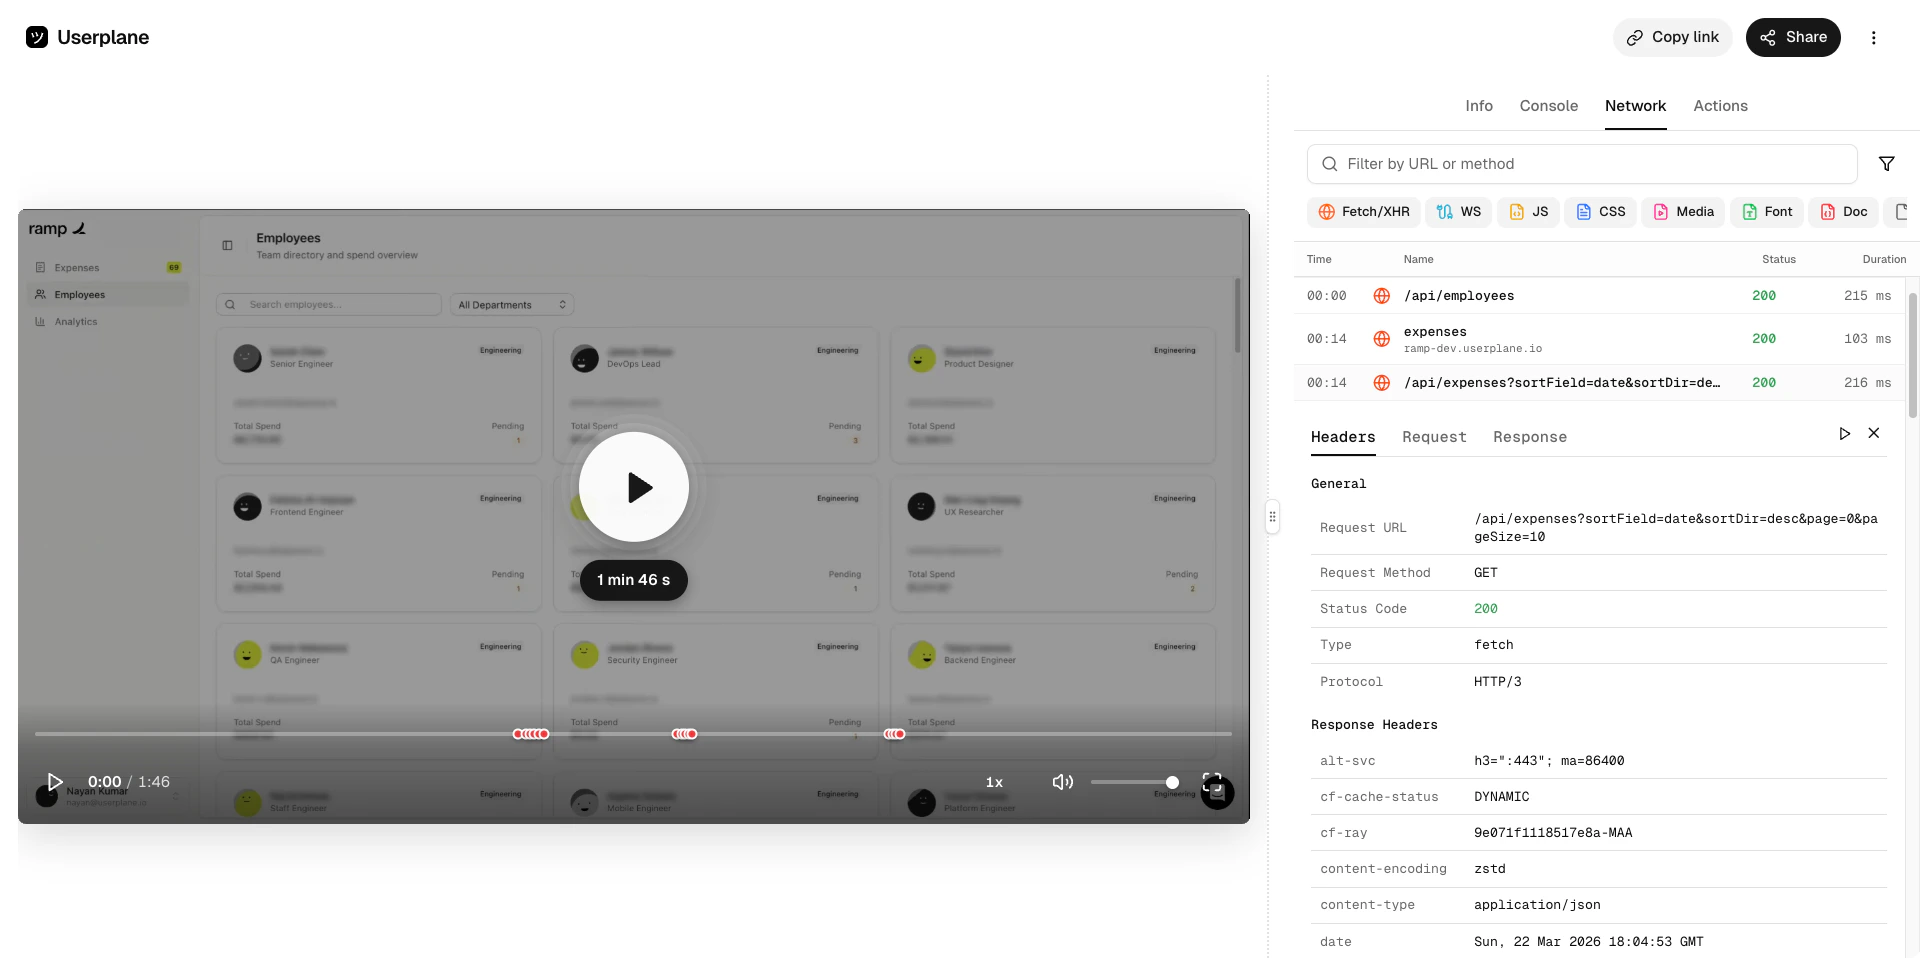
Expand a request to see the full URL, status code, timing breakdown, request and response headers, and body content.
Network request detail
The network panel stays in sync with the video — the active request is highlighted as the video plays, and clicking a request jumps to the corresponding moment.
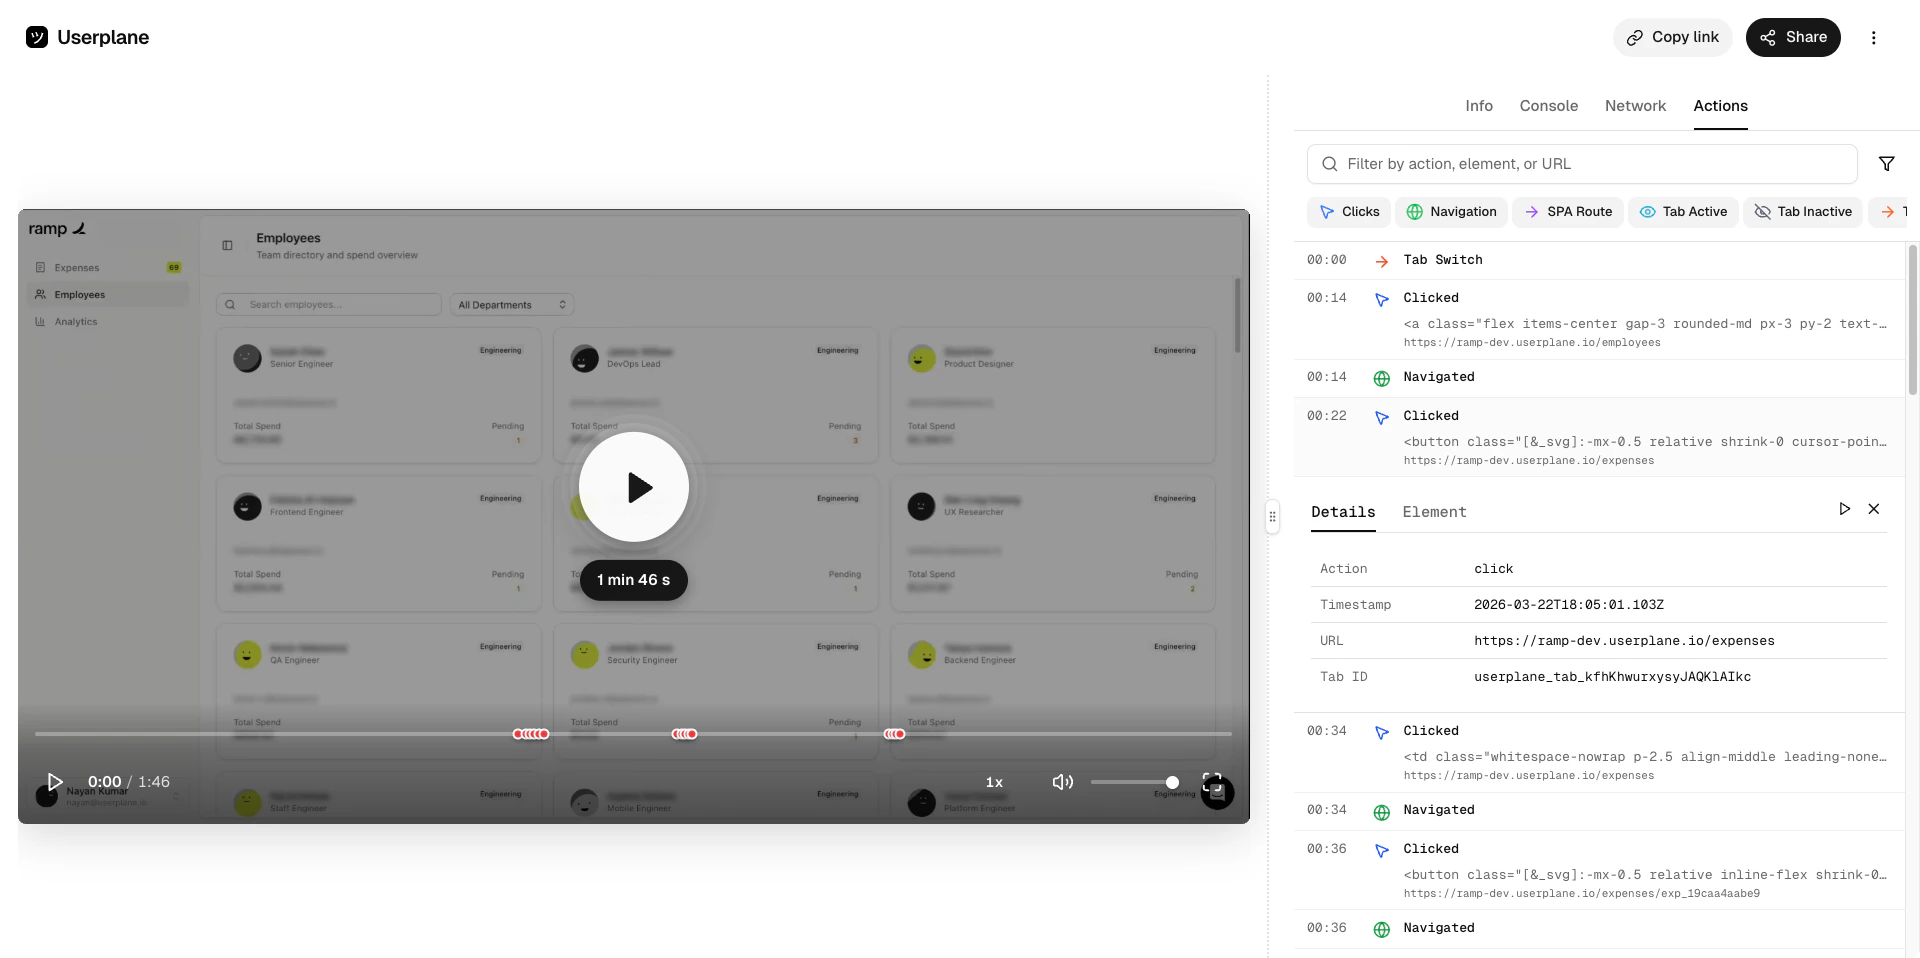
The Actions panel captures user interactions — clicks, text inputs, page navigations, and tab switches — with timestamps. Use it to reconstruct exactly what the customer did and in what order.Click any action to jump the video to that moment.
Recording details
Synced with playback
The actions list shows all captured interactions chronologically. Click any action to expand it and see additional detail.
Actions list
Actions panel
Action detail
The actions panel stays in sync with the video timeline. As the video plays, the current action is highlighted — and clicking any action jumps the video to that moment.